INTRODUCTION
This note presents the research, synthesis, and pedagogy on the approach to scaling up development projects. Scaling-up is indispensable for transforming development financing mechanisms, yet it remains an emerging approach. This work therefore contributes to ongoing efforts toward the adoption of a systematic scaling approach. It provides an overview of the necessary methodology, drawing on numerous studies, particularly those by the Scaling Community of Practice (SCoP), and employing an operational lens shaped by the experiences of the Agence Française de Développement (AFD).
The international aid architecture is seeking new momentum
In 2023, the Paris Summit (“A new global financing pact”) began with the observation that “the responses provided by the international community today are fragmented, partial, and insufficient.” The very term development has long been called into question, seen as vague and conveying an overarching vision of Global North benevolence over the Global South and .In the recent past, there has been a growing awareness that global unmet needs far exceed what traditional bilateral and multilateral donors can provide (today less than €150 billion per year against total financing needs estimated at fifty times that amount), making it essential for these actors to play a catalytic role above all else.
The preliminary statement of the Seville Conference (FFD4) expressed: “Progress in achieving the SDGs is severely off track, with financing issues at the heart of the sustainable development crisis. The existing international financial architecture, financing policies, and investment in sustainable development has not reached expectations,.” The final declaration, the Seville Commitment, noted in its introductory remarks: “the gap between our sustainable development aspirations and financing to meet them has continued to widen, particularly in developing countries, reaching an estimated 4 trillion United States dollars. We cannot afford a retreat from multilateral cooperation.”
In parallel, there has been a call to rethink the formulation of the Global North – Global South dichotomy and the way their relations are conceived. The Director General of the AFD, in his book ‘Réconciliations’, states “I believe that development agencies (i.e. the public financial institutions responsible for supporting economic, social, and environmental transitions) have a major role to play in shaping these necessary ‘reconciliations’. The institutions can lead development efforts effectively only on the condition that they renew the narrative that drives them and underpins their actions, instruments, and positioning, and place themselves at the forefront of the effort to reconcile finance with sustainable development and climate.” (Pg 111, Remy Rioux, 2019)
For about ten years, the Scaling Community of Practice (SCoP) has brought together individuals convinced that the project approach is not an adequate response to the planet’s problems, at least not unless it is followed through to scale. Within this community, there are now more than 5,000 people across all organizations, with a majority coming from the Global South.
The body of work scientifically demonstrating impact, notably that of Esther Duflo, whose research earned her the Nobel Prize, stems from a fundamental need to generate evidence as a foundation for scaling. This principle is central to the mission of the Fonds d’Innovation pour le Développement (FID), which she chairs, supporting both rigorous impact evaluation and, at later stages, the pathways to scale successful innovations. Experience shows that most projects describe themselves as pilots or demonstrators for a greater ambition and scale. This framing reflects the reality that project scope is constrained by available donor funds. The hope is that strong results will catalyse wider replication, but reality is otherwise: replication, if not supported, does not occur. Hence, in the words of the SCoP’s co-chair, we have “pilots to nowhere,” or, as the president of a large Indian NGO puts it, “junkyards of pilots.”
Why have we never done it?
Jean-Michel Sévérino, former Chief Executive Officer of Agence Française de Développement (AFD), offered an insightful perspective during a day devoted to scaling in June 2025 in Paris, acknowledging that “everyone agrees that it needs to be done, the concept is not contested, and yet we have never succeeded in implementing it. Why? That is the big question.”
He first recalled that the challenge of scaling is not new; it has been debated for decades, particularly in the 1990s when Official Development Assistance (ODA) was already declining, before regaining momentum in the early 2000s. At the time, the Millennium Development Goals (MDGs) and the rise of global public goods justified additional resources. However, during that period, much of the discussion actually revolved around a mistaken concept: “doing more with less,” in search of new ways to make ODA more effective.
A first reason, organizational in nature, is that “we are fragmented; we work in silos everywhere, in both the private and public sectors. Compartmentalization is probably a key problem.”
Another reason is what he called a form of “context scepticism” within the aid industry:
“If we think about it, one of our central concepts in aid—and here we are primarily speaking about ODA—is to respond to the needs of the client or partner. Hence the idea that these needs are highly specific, and that transferring an idea from one place to another is suspect: because, being standardized, it would not fit the concept. And, by the way, there is some truth in that. I would in fact recommend that everyone read an excellent book by French researcher Olivier de Cerdan entitled La Revanche des Contextes (2021), which catalogues the mistakes of ODA in developing countries and the application of standards without regard for context. So, there is some validity to this—but that is not what we are discussing here. Nevertheless, this scepticism toward standards constitutes a natural psychological barrier to scaling.”
More fundamentally, Sévérino argues:
“We have never truly managed to move beyond the ‘project concept.’ The project, of course, has its strengths, but also serious limitations. Thinking in terms of projects prevents thinking in terms of scaling, because by definition a project ends—often within relatively short timeframes”. He recalls “I still remember one of my ‘mentors’ in development, who was director when I was a very young professional in the 1980s, who kept saying good technical assistance is assistance that leaves, and a good project is a project that ends.’ That says a lot about the mentality of our industry. And if I’ve grown up with this type of lesson in mind, how many of us have also grown up that way and what type of consequences has it had in our way to address instruments, financing mechanisms, etc. in our industry?”
At the same time, the world has changed, and the valid reasons for not pursuing scaling in the past are perhaps less relevant today. As recalled during the same seminar by Richard Carey, former Director of the OECD-DAC (Development Assistance Committee), there is now a (still emerging) recognition of the limitations of siloed interventions. This growing recognition is that scaling is not merely about increasing financing (via blended financing or better multilateral development bank capital use for example), but about fostering a transformational shift in the operating environment. This takes the aid industry beyond the aid effectiveness concepts developed over four DAC High Level Forums on Aid Effectiveness in the 2000s, when scaling was left out of the set of the five concepts – ownership, alignment, harmonization, managing for results and mutual accountability. Without scaling to bring development actors together in long term pathways to meet needs at scale, the aid effectiveness principles were poorly attained by donors as monitoring indicators revealed, even though developing countries made progress on strengthening country systems.
Finally, it must be acknowledged that the objective of aid providers has long been centered on a single metric: each country’s contribution toward reaching the equivalent of the 0.7% of Gross National Income target. Today, the discourse focuses much more on impact and catalytic mobilization. The notion of mobilization has in fact become one of the three pillars of AFD’s new strategy.
Change in logic
Financing a development project through an external donor rests on a simple assumption: that the partner or client knows what they want and has both the technical and financial capacity to deliver it. In practice, these three conditions are rarely all met, which is why — despite the longstanding calls for donor coordination — donors end up competing for the same capable partners.
If we want to expand the realm of possibilities and move from a logic of means to one of needs, donors will have to engage in a game that is, if not more complex, at least different. Even in the case of a project, the three conditions are never fully met, and financial intervention whether in the form of a loan or a grant, will often be accompanied by a technical assistance component. In the case of scaling up, other actors will be even further from meeting the conditions of bankability or effective implementation. Often, aware of their shortcomings, they may not even be willing to commit to replication. The exit from a project will then be: (i) to move on to something else (a tendency encouraged by staff turnover), (ii) to do a repeat deal (with the same partner or another), or (iii) to develop the intervention into a public policy. But even in the latter case, the underlying business environment conditions often remain unresolved, and needs may remain unmet for a long time.
Scaling is a broadened response to needs. It can be refined by adding a transformative dimension i.e. ‘transformative scaling’ or by referring to the definition of International Fund for Agricultural Development (IFAD):
Scaling-up refers to “expanding, adapting and supporting successful policies, programmes and knowledge, so that they can leverage resources and partners to deliver larger results for a greater number of people in a sustainable way.”
Operationally, if one wishes to provide a satisfactory follow-up to a pilot, the scaling process unfolds in three steps. First, a systemic vision must be developed. Second, a strategy must be built to create an enabling environment for investment, taking into account the diversity of actors and identifying gaps of all kinds (capacity-related, regulatory, cultural). Finally, a coalition of financiers must be assembled—starting with national actors—since the broader coverage of needs cannot be addressed by a single donor, or even co-financing. None of these elements is inherently complex: developing a scaling vision, for instance, closely resembles conducting a market study. The most difficult task is often bringing national partners and international donors around the same table, given the entrenched habit of working separately.
This paper aims to take stock of the issue in a relatively concise and operational manner. As scaling is still an evolving approach, it does not claim to offer definitive “lessons.” Rather, it proposes a reflection, at times advocacy, and an invitation to engage in experimentation and research.
The first part of this paper will outline the current limitations of the system by presenting a general overview of the depth of the global financing gap and the fragmentation of aid, then by examining, in a specific country and sector, the limits of the project-based approach. This section, necessarily critical and potentially uncomfortable, is intended to help us face reality if we are to make genuine progress and embrace a new approach.
The second part will set out, in the form of recommendations, the methodology of scaling in action based on practical experiments: vision, strategy, and financing. It will highlight what must be added to traditional project analysis: the scaling vision already mentioned, an in-depth analysis of the economic model (necessary to convince stakeholders), a theory of change, and the inclusion of local financial actors, starting with public development banks, which are often overlooked.
In conclusion, at a time when the international community’s appetite for development appears to be waning, we may recognize the real value of taking the opposite path—that is, increasing our efforts—by acknowledging that scaling, in its transformative dimension, represents a form of sustainable solidarity investment: an immediate expense for a greater future return, achieved collectively and enduring because it builds not an isolated project but a system in which each actor finds their interest.
CLICK HERE TO READ MORE
FIRST PART: THE NEED FOR A DIFFERENT APPROACH
Finding 1: Aid is insufficient and fragmented but that is only part of the problem
1. Shortfall of ODA
Since Official Development Assistance (ODA) covers only a tiny fraction of global financing needs, its role must evolve.
1.1 A growing funding gap
The world currently faces a rapidly closing window of opportunity to achieve the United Nations Sustainable Development Goals (UN SDGs) by 2030. A key paradox since the adoption of the UN SDGs in 2015 has been that despite the financial flows aimed at meeting the SDGs, the demand for financing has consistently outpaced the resources available.
Between 2015 and 2022, total sustainable finance flows to developing countries increased from USD 4.31 trillion to USD 5.24 trillion i.e. a 22% rise[1]. According to the OECD, sustainable finance flows encompass the combined total of official development assistance (ODA), other official flows, and private sector contributions. This figure represents the gross or net disbursements from both official and private creditors to recipient countries. ODA represents a low share, 200 billion at its highest level, one twenty-fifth of the flows and one fiftieth of the needs when accounting for the gap (see below).
This upward trend, however, suffered a major setback in 2024: for the first time in 30 years, the ODA effort of major donors—France, Germany, the United Kingdom, and the United States— declined. Consequently, the OECD now projects a 9 to 17% decline in ODA in 2025, following a 9% drop in 2024.[2] (See Figure 1.1)
| Figure 1.1. Trends in total ODA from DAC countries, 2000-24 (official data) and 2025-27 (projections), USD billion, constant (2023) prices
Source: OECD (2025) |
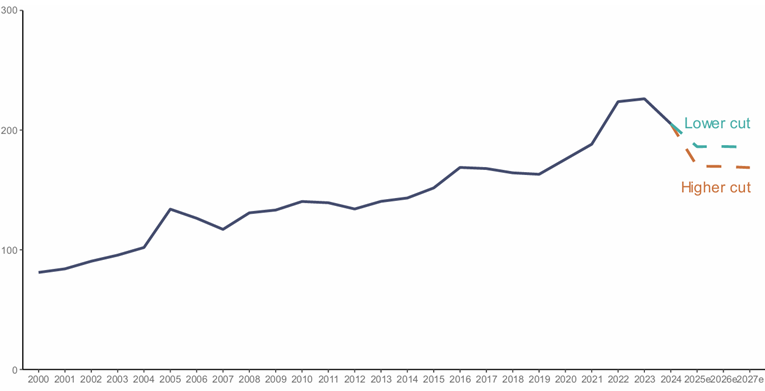
In itself, given its relative magnitude, this decline would have no major consequence — unless it deepens thereby eliminating the opportunity to shift toward catalytic, transformative mobilisation. Development aid organizations are in a position to adopt a systemic and long-term vision, provided, of course, that they commit to this new direction. This is why many in Seville viewed this shock as an opportunity for positive change.
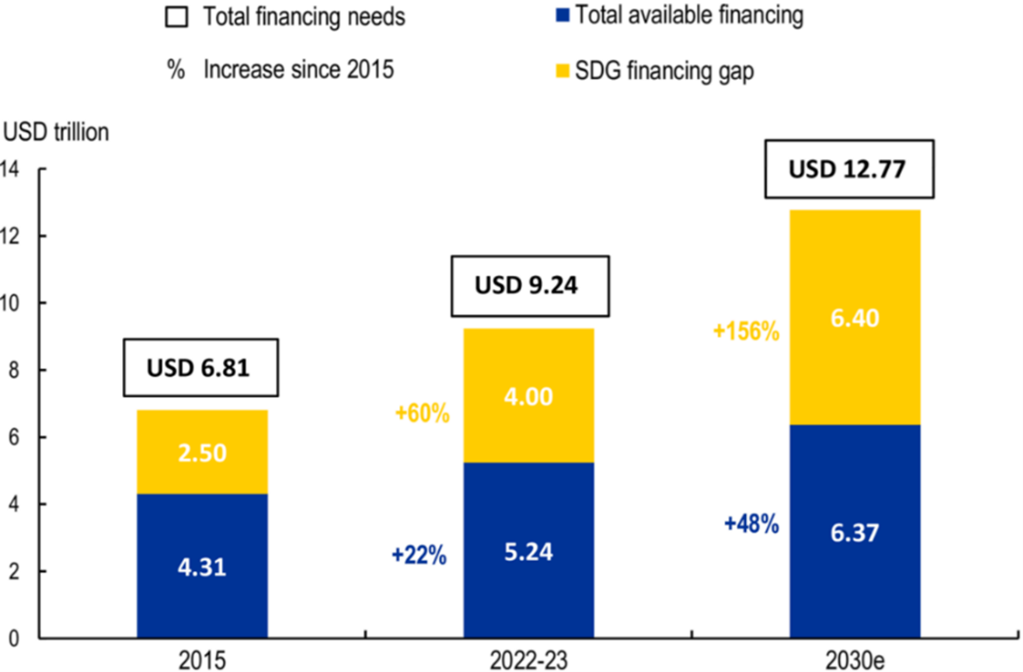
Thus, the annual financing gap for achieving the SDGs has reached alarming levels. The UN Trade and Development’s (UNCTAD) latest estimates reach USD 5–7 trillion per year, with USD 3.3–4.5 trillion concentrated in developing countries[3]. As of 2025, around half of the 140 SDG targets (for which data is available) deviate from their required pathway, with current projections suggesting that nearly 600 million people will remain in extreme poverty by 2030, more than half of them women[4].
| Figure 1.2. SDG financing gap, 2015-30 (estimated)
Source: OECD (2025) |
Several studies have proven that the SDG sector-specific financing gaps are considerable:
- Infrastructure: USD 1.5–2.7 trillion per year for low- and middle-income countries i.e. LMICs (World Bank)[5];
- Health: USD 370 billion annually as a requirement to achieve the health SDG by 2030[6] (World Health Organization, 2017);
- Food: USD 540 billion annually to sustainably end hunger (Food and Agriculture Organization, 2024)[7];
- Aggregate of achieving significant progress in health, education, and infrastructure in LMICs: additional USD 2.6 trillion annually (International Monetary Fund)[8];
- Climate: USD 2.4 trillion annually in climate financing by 2030, four times the level in 2019[9].
1.2 The response
The 2025 Conference on Financing for Development (FfD4) at Seville raised a critical call to action for the global community to realign financing efforts with the scale of current challenges[10]. The final report lists all the challenges to be addressed, incorporated into “A Renewed Global Framework for Financing for Development”:
- Mobilizing domestic public resources, strengthening tax systems, promoting budget transparency and accountability, and intensifying capacity-building support
- Promoting investment in sustainable development and establishing domestic financial and capital markets
- Encouraging foreign direct investment and impact investing
- Improving public–private partnerships
- Adopting regulations that support businesses and the financial sector from a sustainability perspective
- Promoting South–South and triangular cooperation
- Increasing and optimizing lending by multilateral development banks
- Strengthening the system of public development banks
Many of these challenges can be structured and brought into overall coherence through a scaling approach: scaling is instrumental in integrating these levers, ensuring alignment with national priorities, fostering coherence among stakeholders, and promoting inclusiveness in financing decisions.
2. Fragmentation of aid
The fragmentation of aid is not a new problem. It is one of the recurring topics across all international conferences under the banner of aid coordination – the 2003 Rome Declaration on Harmonization, the 2005 Paris Declaration on Aid Effectiveness, the 2008 Accra Agenda, the Busan Partnership for Effective Development Co-operation, and so on. It was one of basic premises of the 2023 Paris Summit[11] and one of the issues in international cooperation highlighted for the Seville Summit (FFD4) in 2025[12].
The diagnosis of this fragmentation can be observed in the increase of aid agencies over the past 20 years. The World Bank noted in 2022: in 20 years, the number of bilateral agencies rose from 191 to 502; multilateral agencies from 47 to 70; the share of countries dealing with more than 60 institutions (donor entities) went from 55% to 78%; the average amount of ODA operations was USD 0.8 million in 2019; only 1 intervention out of 4 was implemented by recipient-country governments; 70% of official aid took the form of projects, while pooled financing accounted for only 17% of flows[13].
Surprisingly, some research argues that the impact of this fragmentation on aid effectiveness has not been proven. Some even identify positive aspects. In the cited report, the World Bank notes that the impact of fragmentation on aid effectiveness remains “unclear.” Its conclusions are to reverse the fragmentation trend and to prioritize multilateral channels. Other reports emphasize different facets of this fragmentation, such as misalignment with national policies or high transaction costs for recipient countries.
However, these various reports do not view fragmentation in terms of the absence of a sustained development dynamic, nor as the failure to meet the large-scale needs of beneficiary populations. Addressing those needs requires not only coordinated action by external financiers across a region or sector — something that fragmentation makes difficult — but also a transformative logic and a critical mass that necessarily involves mobilizing local financial resources. This, in turn, calls for coordinated engagement of both external and internal, public and private, financing sources.
Furthermore, as will be shown in the next chapter, it is possible to succeed in implementing projects within a country while still failing to generate the kind of sustained, large-scale development momentum needed to meet even the basic needs of the wider population.
Key takeaways
|
Finding 2: The project-based approach reaches its limits over the long term: as illustrated by the water sector in Ghana
Ghana and the water and sanitation sector are used as an example because of the stability of this West African country and the sector being emblematic of the SDGs and representing one of the most fundamental human needs. This choice was made empirically and not by simply selecting the most problematic amongst the various cases. The aim is more illustrative to demonstrate what fragmentation entails, its possible consequences, and to bring out the need for a different approach. Water and sanitation are often coupled in projects; the analysis will focus on water.
To better demonstrate the limits of the traditional project approach, it is worth noting a few fundamental principles of scaling up:
- Aim for broad coverage of needs through coordinated and continuous interventions by donors alongside local partners;
- Keep in view the underlying economic model in order to design for national ownership;
- Develop national implementation capacities to make countries less dependent on external aid.
The analysis was conducted using IATI (International Aid Transparency Initiative) data for the period 2000–2024[14].
1. Scale and distribution of donor funding
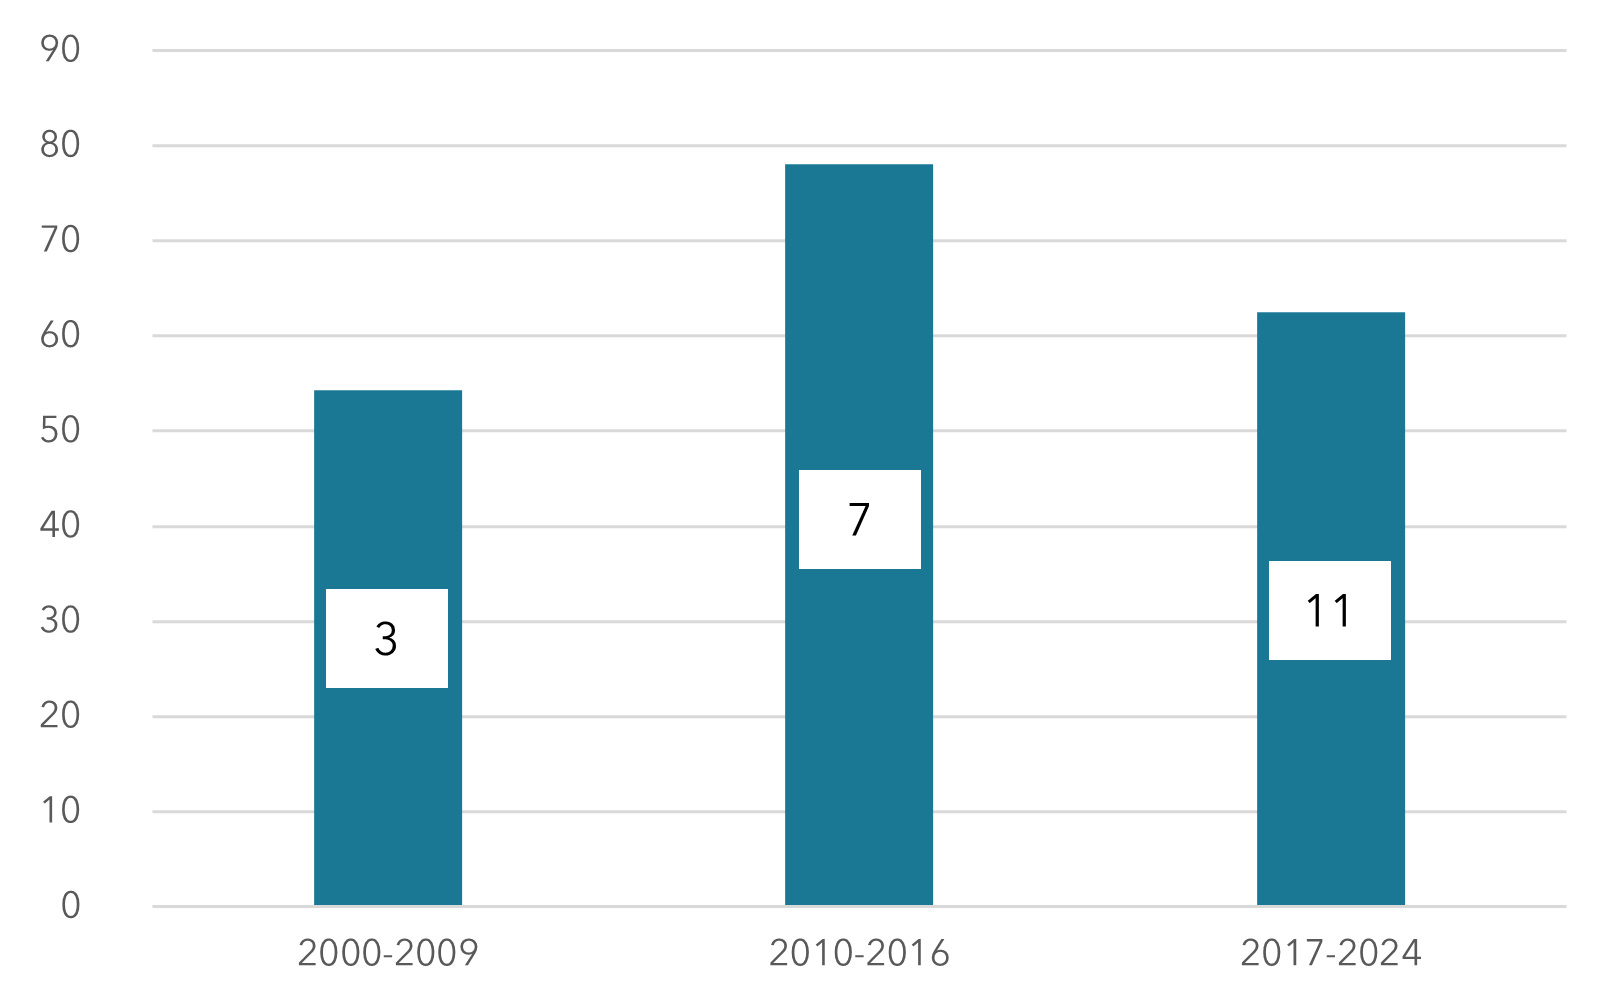
During this period, Ghana received nearly USD 1.5 billion in aid commitments to this sector, i.e., USD 65 million per year: 55% for water, 28% for sanitation (including waste management), and 17% for both (Table 2.1)[15]. Twenty-five reporting entities were identified, with the top five covering 87% of the total (World Bank 55%; AfDB 10%; Canada, the Netherlands, and USAID each 6–8%)[16]. From 2000 to 2009 there were fewer than three entities per year; there were seven from 2010 to 2016 and nearly eleven from 2017 to 2024 (Figure 2.1). Annual amounts did not follow this trend, rising from USD 54 million to USD 78 million before falling back to USD 62 million.
| Table 1.1: Commitments (in USD) of the reporting organisations | |||
| Reporting Organisations | Commitments (USD) | Cumul | Share% |
| World Bank [44000] | 826,838,945 | 56% | 56% |
| African Development Bank [XM-DAC-46002] | 150,772,717 | 66% | 10% |
| Canada – Global Affairs Canada [CA-3] | 113,334,979 | 74% | 8% |
| Netherlands – Ministry of Foreign Affairs [XM-DAC-7] | 111,122,233 | 81% | 8% |
| United States Agency for International Development (USAID) [US-GOV-1] | 90,925,129 | 87% | 6% |
| United Nations Children’s Fund (UNICEF) [XM-DAC-41122] | 72,046,411 | 92% | 5% |
| Germany – Federal Ministry for Economic Cooperation and Development [DE-1] | 50,426,792 | 96% | 3% |
| Netherlands Enterprise Agency [NL-KVK-27378529] | 27,820,423 | 97% | 2% |
| Denmark – Ministry of Foreign Affairs [XM-DAC-3-1] | 8,681,061 | 98% | 0.6% |
| European Commission – International Partnerships [XI-IATI-EC_INTPA] | 8,362,640 | 99% | 0.6% |
| Global Environment Facility Secretariat [XI-BRIDGE-6385676864] | 7,000,000 | 99% | |
| VEI (Vitens-Evides International) [NL-KVK-08134161] | 3,472,800 | 99% | |
| Australia – Department of Foreign Affairs and Trade [AU-5] | 3,214,781 | 100% | |
| Bill and Melinda Gates Foundation [DAC-1601] | 2,044,157 | 100% | |
| GSMA Foundation [US-EIN-37-1552838] | 1,383,398 | 100% | |
| Finland – Ministry for Foreign Affairs [FI-3] | 911,638 | 100% | |
| Netherlands Committee of the International Union for Conservation of Nature (UICN) [NL-KVK-41180885] | 815,764 | 100% | |
| Sweden – via the Swedish International Development Cooperation Agency (SIDC) [SE-0] | 789,810 | 100% | |
| Simavi [NL-KVK-40594571] | 570,756 | 100% | |
| African Development Foundation [US-GOV-13] | 91,500 | 100% | |
| Republic of Korea [KR-GOV-010] | 42,573 | 100% | |
| Germany – Federal Foreign Office [XM-DAC-5-7] | 31,207 | 100% | |
| Elrha [GB-CHC-1177110] | 21,997 | 100% | |
| None [US-GOV-11] | 10,000 | 100% | |
| United Kingdom – Foreign, Commonwealth and Development Office [GB-GOV-1] | 0 | 100% | |
| 1,480,731,711 | |||
| Figure 1.3: Average annual commitments (million USD) and number of declarants
Source: Author |
The number of financial cooperation providers is three times that of reporting entities (71). The AfDB, for example, has four (AfDB, ADF, African Development Fund, and the Government of Ghana). UNICEF lists 43, five out of six showing insignificant amounts (less than USD 1 million over the period).
Interventions in water and sanitation include concerns regarding supply, resource protection, management and administrative policy for water, liquid/solid waste management, and storm-water drainage for sanitation. These concerns could be tackled individually, jointly, at a regional scale or across a wide range of subsectors and domains. Germany, for instance, focused from 2003 to 2015 on rural drinking water, then from that date on e-waste recycling (considered as a part of sanitation).
Focusing on the eight largest contributors of funding listed above already confronts us with nearly 200 distinct interventions which is the first indicator of widespread dispersion of development efforts. To aid our introspection particularly regarding outcomes, we will restrict our analysis to interventions in the rural water subsector. In potable water supply, donors operate either in Greater Accra and major secondary cities or in rural areas which are defined as small towns and communities and the domain of a dedicated national agency, Community Water and Sanitation Agency (CWSA).
2. Water coverage outcomes
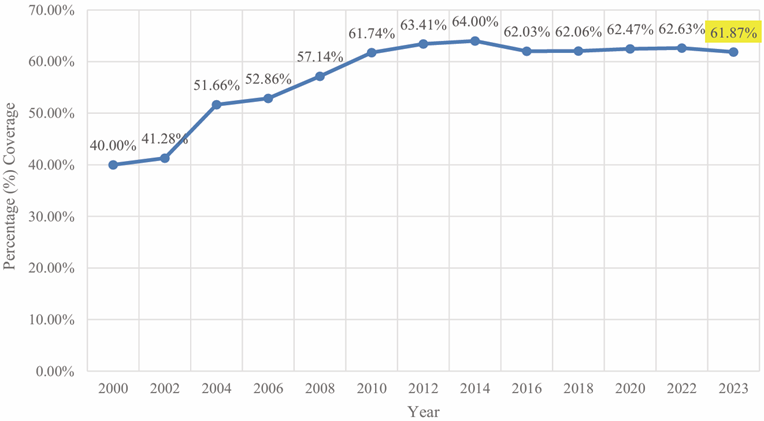
The chart below is taken from the 2023 annual report of the CWSA. The Ghanaian agency, created in 1998, is tasked with operating in small towns and communities, potentially 29 million inhabitants out of the country’s 34 million[17] (Figure 2.2). The potable water (safe water) coverage rate for that population now stands at 62%, according to the most recent report; notably, this rate has stagnated since 2010[18]. Clearly, aid has failed to generate a dynamic allowing broader coverage of needs after an initial phase of progress: today, 9 million people in Ghana still lack this basic resource. The annual report attributes this underperformance to stagnant investment despite a growing population (20 million in 2000; 25 million in 2010; 34 million in 2024 i.e. an annual rise of 2.24%) and increasing network failures.
In specific instances, certain projects, such as the AfDB project in the Ashanti region (2004–2011), achieved coverage rates of 80%, which then fell back to 59.3% in 2023 (according to the same report). The Government of Ghana’s target for 2015 was 75%.
| Figure 1.4: National Community Safe Water Coverage in 2023
Source: Annual Report CSWA 2023 |
Donor contributions (for the whole water and sanitation sector) reached peak commitments and disbursements during 2010–2019. For all of 2000–2024, there is a stable trend in commitments but a rising trend in disbursements (Figure 2.3, Table 2.1).
| Figure 1.5: Engagements and Disbursements – Water and Sanitation in Ghana (Million USD)
|
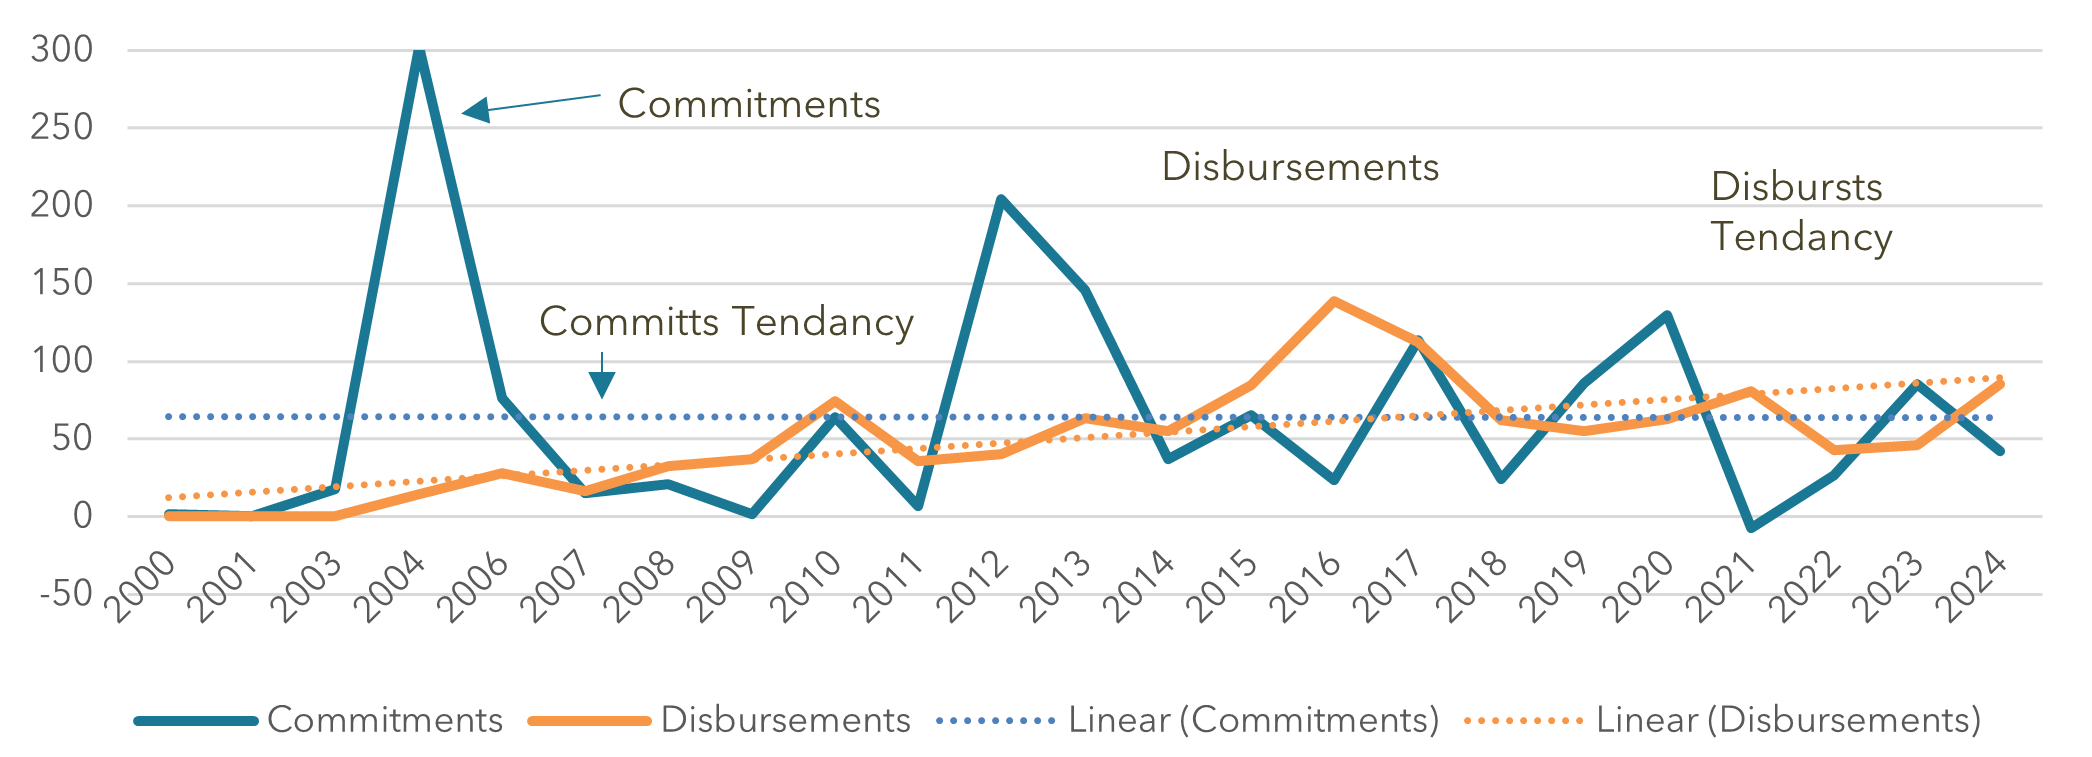
| Table 1.2: Commitments and disbursements – Water and sanitation in Ghana (Million USD) | ||||
| Commitments | Average | Disbursements | Average | |
| 2000-2009 | 435 | 43 | 128 | 13 |
| 2010-2019 | 770 | 77 | 720 | 72 |
| 2020-2024 | 276 | 55 | 317 | 63 |
3. Diagnostic: why the project approach fell short
By way of preamble, note that despite transparency efforts, publicly available institutional reports are relatively limited, except for those of multilaterals (AfDB and World Bank), which publish both initial and final evaluations. For other donors, one often finds only an intention summary and sometimes a comment on achieved results which constrains the analysis. Even so, the information collected identifies several factors which may have prevented Ghana from reaching its safe water goals. This overview is not intended to explain everything nor to assign blame.
Primary constraints in scaling safe water interventions in Ghana:
- Superposition of region-scale interventions and pilot/localized projects;
- Predominance of the project approach;
- Discontinuity of interventions over time;
- Geographical dispersion;
- Weak co-financing and surface-level harmonization;
- Low levels of national counterpart funding, local shares of projects financed in foreign currency;
- Implementation not systematically entrusted to national bodies;
- Economic analysis without practical consequences;
- Ultimately, no catalytic effect.
3.1 Partial and discontinuous interventions
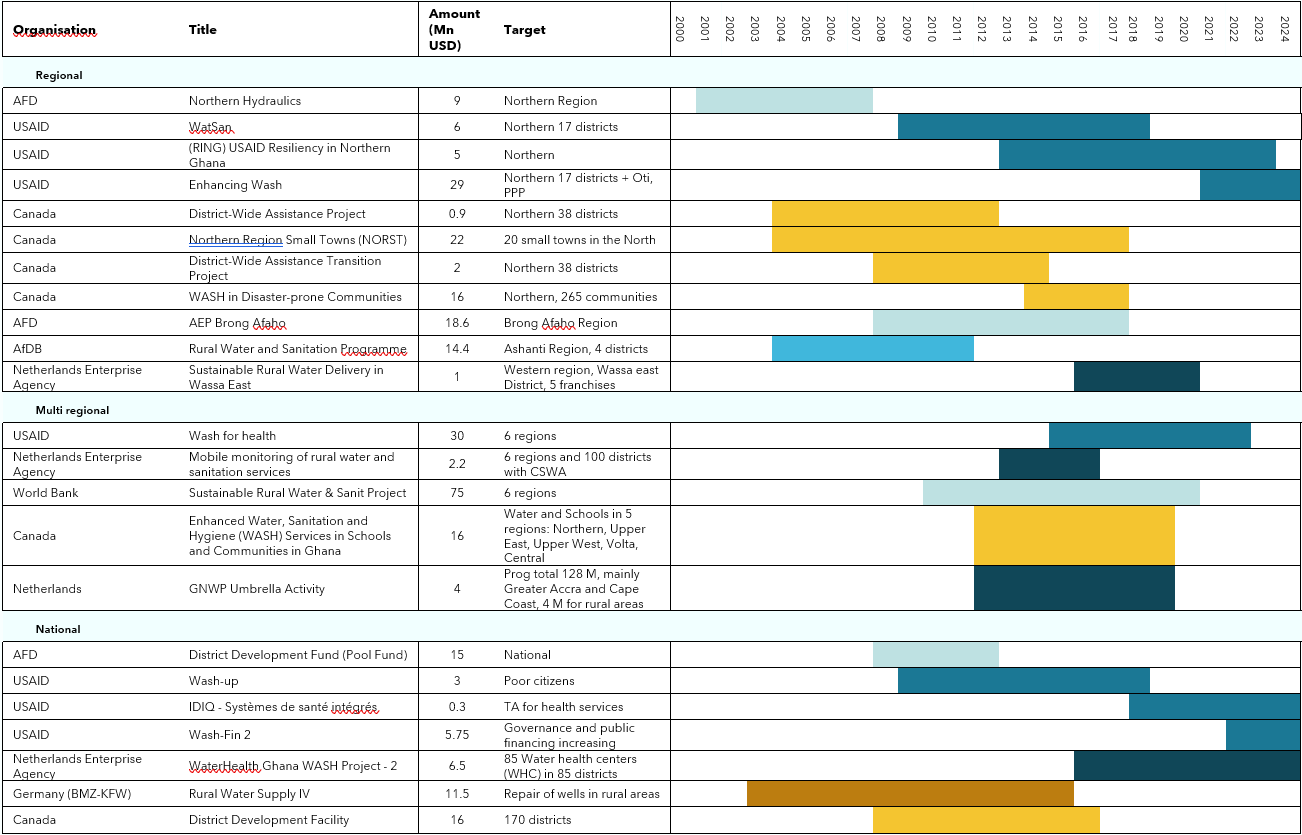
On the surface, if we refer to the map of interventions, they appear to have covered the national territory fairly well: with the exception of the Eastern Region (10% of the national population), the other nine regions received specifically allocated funding[19] (Figure 2.4). Table 2.2 below shows the timing of the main interventions.
Figure 1.6 Map of Ghana prior to the 2018 regional reform and rural water interventions.
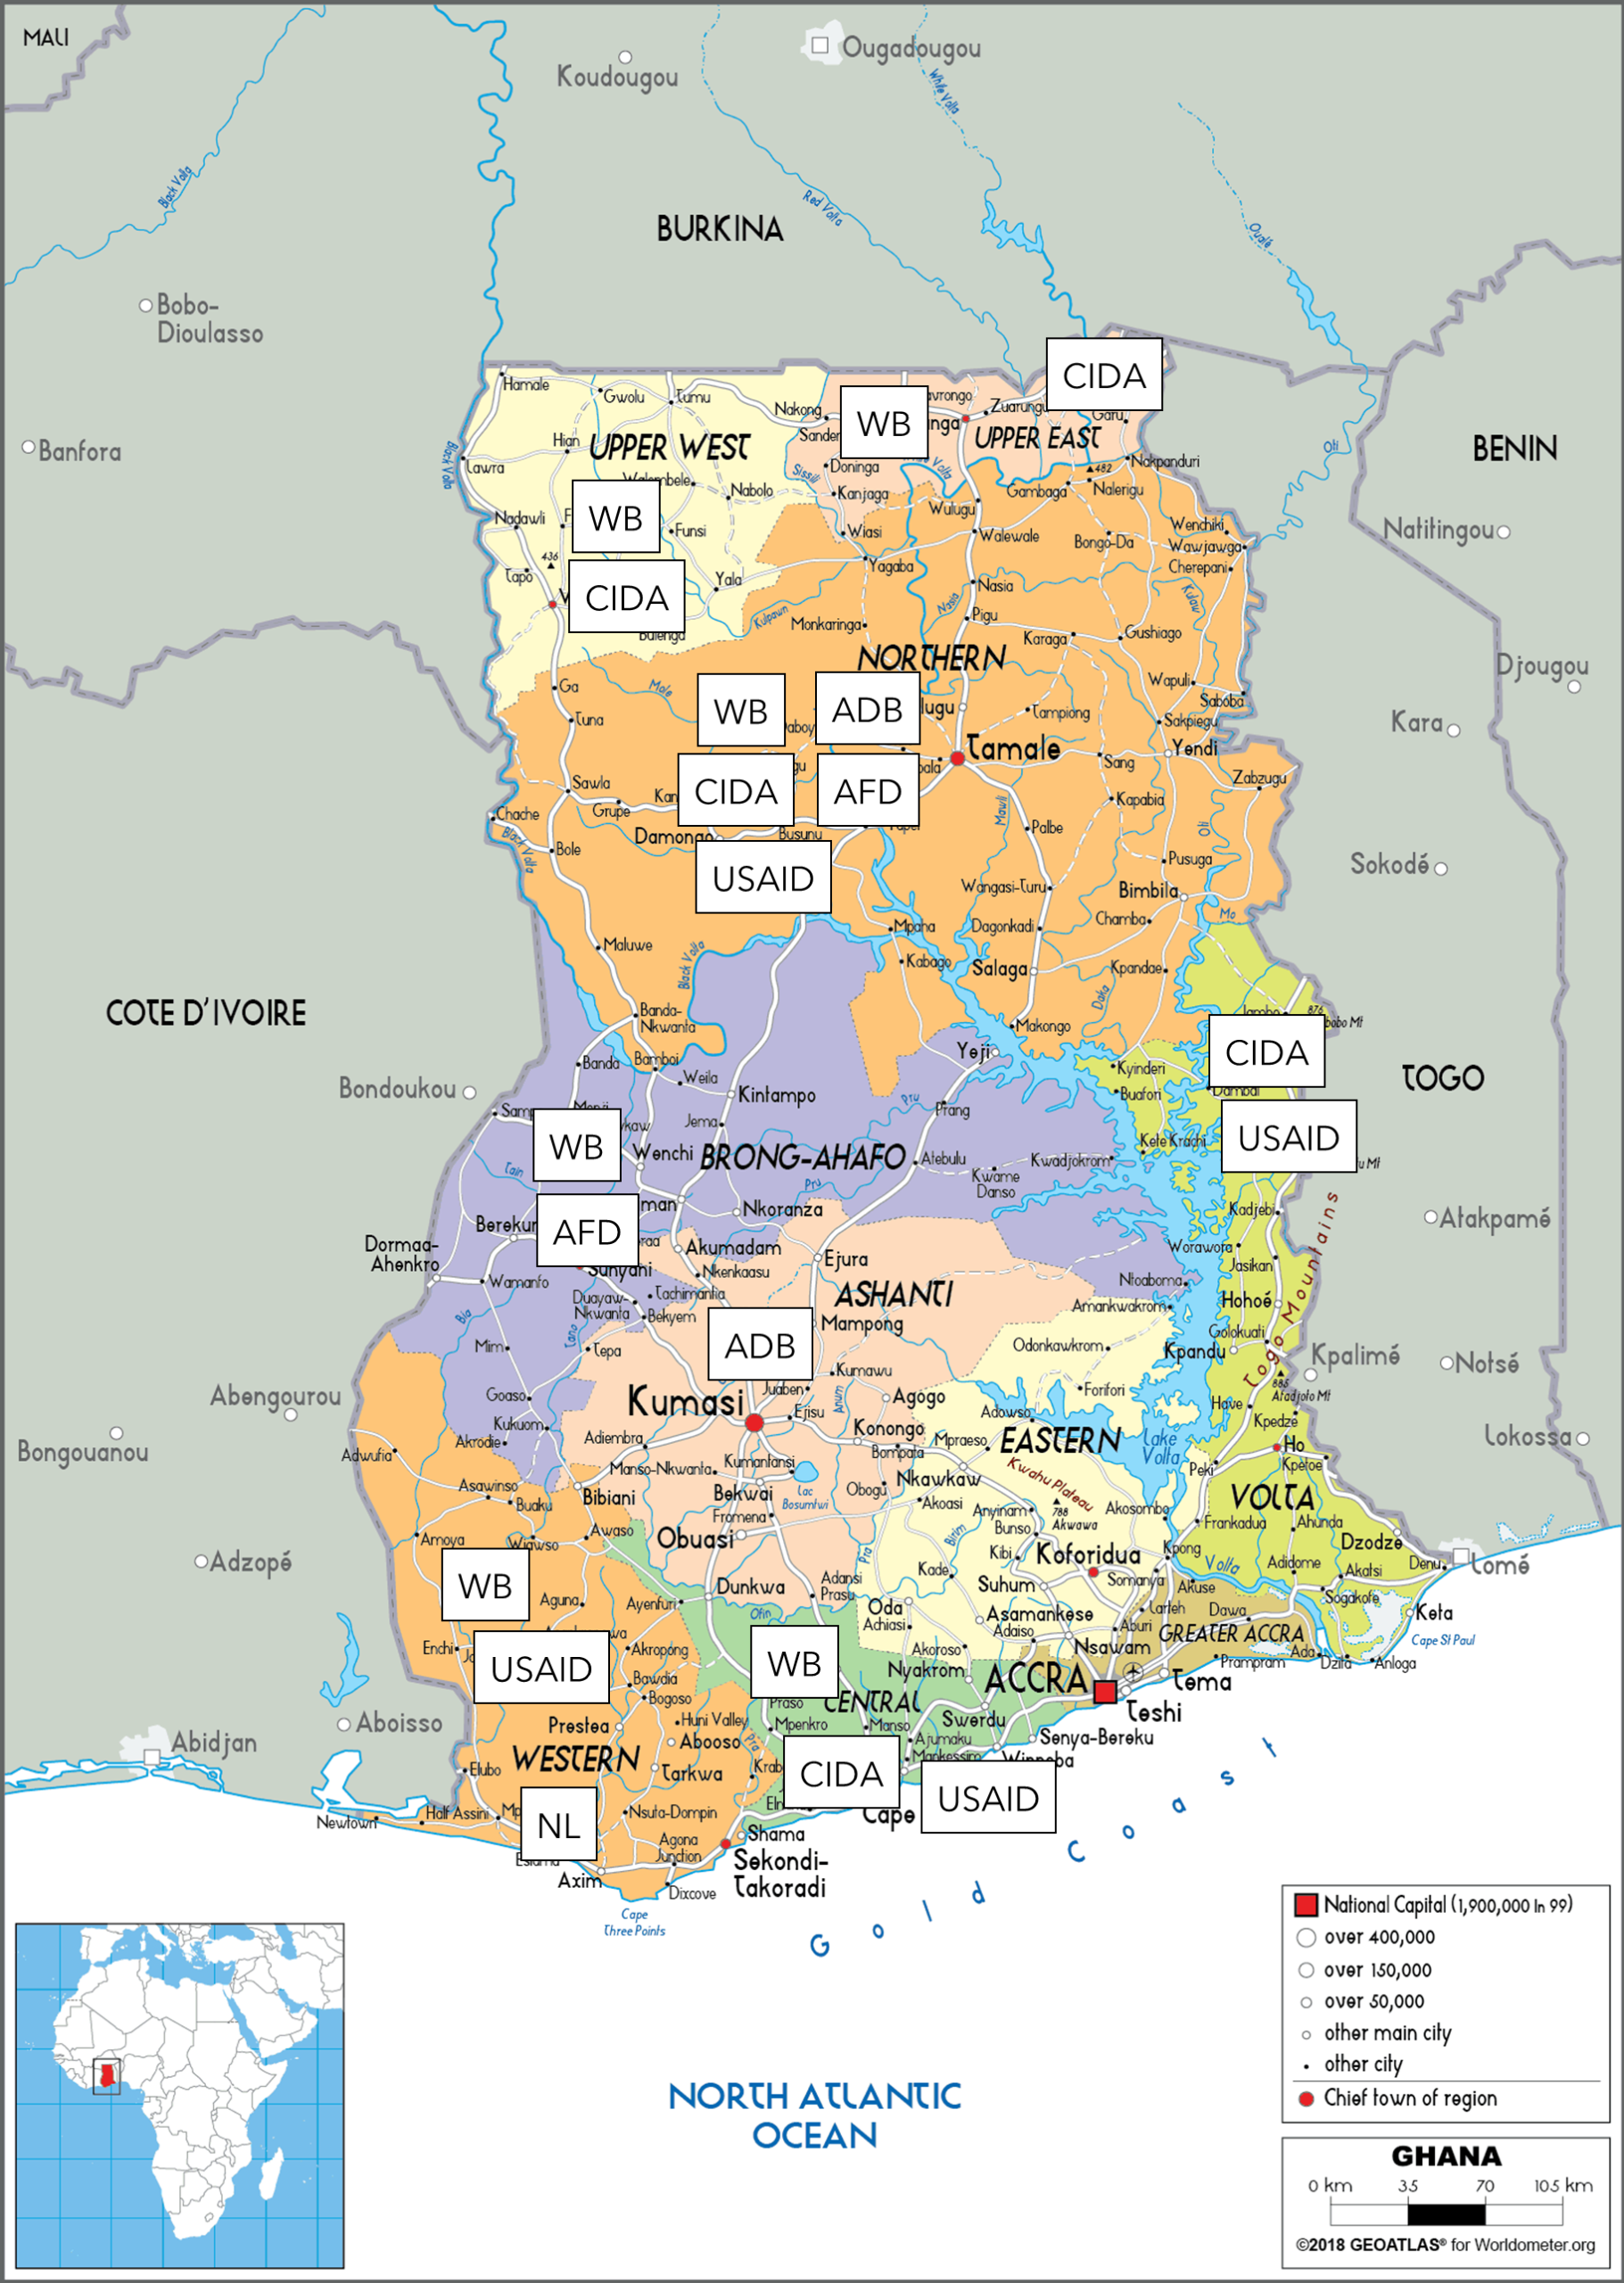
Large size Political Map of Ghana – Worldometer ADB = African Development, AFD = Agence Française de Développement, CIDA = Canadian International Development Agency, NL = Nederland, WB = World Bank
Table 1.3: Characteristics of water interventions in Ghana
However, this apparent national coverage was far from meeting the total needs of these regions. The proportion of the population reached represents only a small percentage of the total population: 5% for the six regions covered (600,000 people out of 11 million) by the World Bank project (Sustainable Rural Water & Sanitation mentioned above) and the same proportion were covered by the AFD project in the Northern Region (110,000 people out of 2 million, 7 districts covered out of 16 in the region).The AfDB project in the Ashanti Region covered only 4 of the 27 districts in the region.
In its preliminary evaluation report, the World Bank specified that investments would be prioritized in District Assemblies (DAs) whose capacities have been strengthened. This leaves out the weakest DAs. While this logic aligns with a project efficiency objective, it does not support scaling up.
If we accept that these projects were fully aware that they covered only a fraction of the needs, we can also question the often one-off nature of the interventions: AFD intervened once in two regions (North and then Brong Ahafo), AfDB once (Ashanti Region), and the World Bank once in six regions (including the two covered by the AFD project)[20]. Canada implemented four projects in the Northern Region between 2004 and 2018 but did not continue thereafter. The table also shows that no large-scale regional project was launched after 2015, apart from the USAID project in 2021 (Enhancing WASH) for USD 29 million, even though needs remain substantial. There appears to have been a halt in donor interventions in the sector.
These projects were implemented over long durations, almost systematically exceeding initial projections: 7 years for the AfDB project, 10 years for the World Bank project, and up to 12 years for others, not including evaluation time. Compared to the standard reference duration of five years, this extended timeframe limits the sequencing of interventions. The reasons cited are consistently the same: difficulties in meeting conditions precedent, most often related to mobilizing the required financial counterpart, and longer-than-expected procurement processes.
It is also worth noting the cancellation in 2014 of a major financing package for four regions (Western, Eastern, Central and Volta) for a water and sanitation programme, with €40 million each from AFD and the EIB in highly concessional loans, along with two grants from the European Union and the Gates Foundation, totalling €93 million. Approval had been granted in 2012, two years earlier. Initially, faced with a deteriorating macroeconomic situation, Ghana’s Ministry of Finance delayed any new borrowing, even highly concessional loans, in 2013. Subsequently, in 2014, the technical ministry requested a substantial revision of the project (shifting toward an urban rather than rural focus, changing the regions of intervention, etc.). Despite announcements expressing a willingness to continue dialogue and intervene in the sector, this cancellation marked a break.
3.2 Harmonization in question
The issue of aid harmonization reflects poor: coordination of projects to ensure coherence among them, sharing of financial effort between the government and external donors, and project implementation modalities (ownership of aid).
3.2.1 Project coordination
Ghana was long considered exemplary in this respect, but several weaknesses can be observed: limited joint financing, an incomplete sector-wide approach, and largely informal coordination.
When AFD’s participation in the District Development Fund was approved in 2008 alongside KfW, CIDA, and Danida, Ghana was described as a “pilot country for aid harmonization.” This pooled fund, supporting decentralization at the district level, was indeed a strong example[21], although it remained an exception, along with another pooled budgetary financing mechanism, the Multi-Donor Budgetary Support (MDBS)[22]. The majority of interventions continued to take the form of project-based aid. In the 2000s, the government established institutional dialogue with donors to support public policy implementation.
In the water and sanitation sector, the situation in 2012 (i.e. the year the joint AFD–EIB sector support programme) was mixed. On the Ghanaian side, the administration was structured around three bodies: (1) the Ministry of Water Resources, Works and Housing (MWRWH), responsible for defining water policy; (2) the Water Resources Commission (WRC), a public body in charge of integrated water resource management and action planning; and (3) the Ministry of Local Government and Rural Development (MLGRD), responsible for governance aspects. On the donor side, a sector working group bringing together public authorities, the private sector, civil society and donors worked for several years to develop a Sector-Wide Approach (SWAp) in water and sanitation. However, this had not materialized due to a lack of consensus on key issues, such as the scope of the SWAp and the respective roles and responsibilities of stakeholders.
A Water Sector Strategic Development Plan (2012–2025) was launched in 2015, but, as will be seen below, this occurred at a time when donors were reducing their interventions.
From the available project documentation, what emerges is the low proportion of co-financed projects. The AFD projects in the Northern and Brong Ahafo regions, as well as the AfDB and World Bank projects, were not co-financed. The only apparent co-financing arrangements were the district pool fund and two European Union joint financings with the UK’s Department for International Development (DFID) and UNICEF (non-exhaustive analysis).
Moreover, in project presentations to decision-making bodies, coordination of interventions is described in a largely informal manner. Annex 2 of the World Bank’s Project Appraisal Document for the 2010 Sustainable Rural Water & Sanitation Project provides an incomplete list of recent or ongoing projects by other donors. Neither this table nor the main body of the document provide any analysis of complementarity or coherence among these interventions. It is merely an inventory, demonstrating that the World Bank is not acting alone in the sector. The same observation applies to other donors, where documentation is available.
3.2.2 Limited national counterpart contributions
There is an apparent paradox between the funding distribution announced in the 2015 national strategic plan, in which donors (Development Partners) were expected to contribute 49% (Table 2.3, top panel), and the project financing plans, where they actually provided between 90% and 100% of total funds (Table 2.3, bottom panel).
Table 1.4: Sources of Financing WSSDP
| Source | Total Amount (US$ m) | Total Amount (GH₵ m) | Average Annual (US$ m) | Average Annual (GH₵ m) | % |
| Development Partners | 2,653.04 | 6,706.88 | 189.5 | 479.07 | 48.98 |
| MMDAs | 327.14 | 827.01 | 23.4 | 59.07 | 6.04 |
| Household Contribution for Basic Sanitation Only | 189 | 477.79 | 13.5 | 34.13 | 3.49 |
| GoG | 2,247.30 | 5,681.17 | 160.5 | 405.8 | 41.49 |
| Total | 5,416.48 | 13,692.85 | 386.9 | 978.07 | 100 |
| BAD 2004 | AFD 2007 | AFD 2008 | BM 2010 | AFD/BEI 2012 | |
| M$ and % | Ashanti | Brong Afaho | Districts | 6 regions | 4 regions |
| Donors | 12,800 | 18,600 | 101,000 | 75,000 | 92,800 |
| Governments | 640 | 700 | 24,000 | ||
| Communities | 940 | 700 | 2,340 | ||
| Total M€ | 14,380 | 20,000 | 125,000 | 77,340 | 92,800 |
| Donors | 89% | 93% | 81% | 97% | 100% |
| Governments | 4% | 3.50% | 19% | ||
| Communities | 7% | 3.50% | 3% |
Initially, the principle was that investments at the district assembly level were to be covered 5% by the government and 5% by the districts. This arrangement was gradually abandoned, likely for budgetary reasons. In the table, these proportions can fall below 5% (for example, in the 2010 World Bank project) when other project components are taken into account (sanitation, capacity building)[23].
It is also worth noting the difference between the ambition of the strategic plan (189.5 million USD per year) and the commitments recorded by IATI (59 million USD per year between 2015 and 2024). The available documents—multi-year strategies and CSWA annual reports—do not make it possible to identify how funding is distributed between the donors and the CSWA[24].
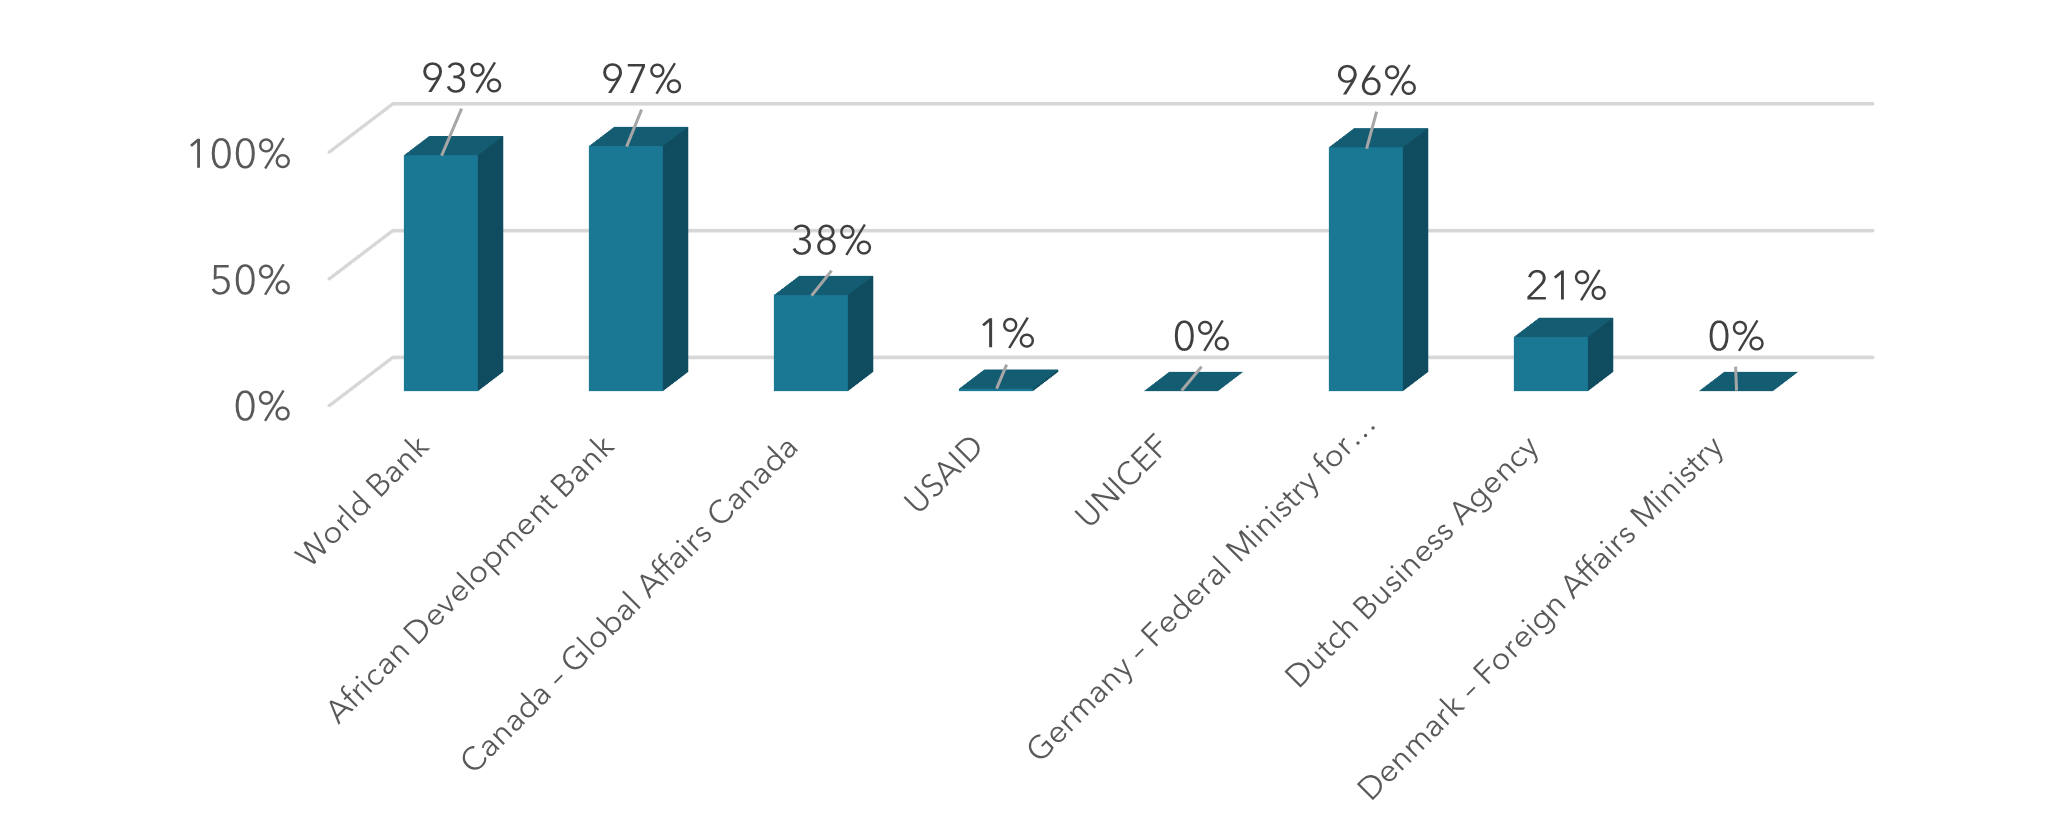
3.2.3 Ownership of aid
In this regard, it is useful to examine the proportion of funding allocated to Ghanaian entities, whether public or private. Among multilateral donors (excluding UN agencies), it is close to 100%, while in some bilateral agencies and UN organizations, it is sometimes low or negligible.
| Figure 1.7: Allocation of aid to Ghanaian operators
|
3.3 Observations from a scaling-up perspective
3.3.1 An economic analysis with no follow-up
When economic analysis is carried out, mainly by multilateral institutions, it seems to be a routine exercise, since no explicit conclusions are ever drawn from it. The 2010 World Bank project calculated an ex-ante projection over 15 years with an expected internal rate of return (IRR) of 25.5%. Ex-post, the analysis brought the IRR down to 17.2%. The expected financial benefits came mainly from water sales and connection fees from new users. The analysis did not cover the sanitation and hygiene components, due to insufficient revenues. An appendix to the initial evaluation report detailed the calculations over 11 pages. The only conclusion drawn is that the project is economically robust and that the revenues collected exceed the repayment of the IDA loan, including principal and interest.
The equivalent AfDB project in the Ashanti region calculated a rate of 21.2% ex-ante and 28.7% ex-post, although the counter-analysis disputes this figure. Nevertheless, the results remain within the same range. The 2012 AFD/EIB project (which was later cancelled) estimated a rate close to 30%.
It is unfortunate that these analyses, which show substantial rates of return on investment, are not used to design national extensions financed by other, local or international, donors.
3.3.2 What role for the private sector in the end?
In the water sector, strengthening the capacity of the private sector to provide goods and services is considered “crucial” in the reports of the World Bank, AfDB, and AFD alike. Private actors are expected to benefit from capacity-building activities implemented through these projects. However, although the private sector is mentioned repeatedly (50 times in the World Bank’s 2010 initial evaluation report), the discussion remains very general and no specific objective is assigned to it. In fact, the ex-post evaluation report no longer mentions it at all.
It can be inferred that building a network of private operators capable of supplying spare parts and maintaining installations (boreholes and pumps) would contribute to the system’s sustainability, and even “more generally serve as a driver of national growth” (World Bank, 2010). Indeed, since scaling up cannot rely exclusively on external financing, the establishment of a national (or regional, across several small countries) technical sector is an essential step toward any large-scale rollout. Without it, investments remain dependent on external funding, which is unsustainable. The second part will show how, through a macroeconomic approach, a self-sustaining dynamic can be envisioned based on a network of local enterprises.
The breakdown of project costs between local and foreign expenditures in evaluation reports, when provided[25], offers valuable insight into the capacity of local actors to participate in sector development. Unfortunately, this data is not systematically available. If it were, and if an ex-post review compared forecasts and actual results, it would be possible to assess how national capacity evolves over time.
An example of such an analytical cost breakdown is given below for the Urban Water Project financed by the World Bank in 2004 (Table 2.5). Local costs were estimated at 47% of the total. This does not prevent the project from being financed up to 90% by external funds, but that is another issue that will be addressed later. Engineering and technical assistance are classified as foreign expenditures, while equipment costs are divided roughly half between local and foreign sources.
Table 1.5: Urban Water Project costs in Ghana
| Component | Local (US$000) | Foreign (US$000) | Total (US$000) | Percent of Total |
| 1. System Expansion & Rehabilitation | ||||
| Production, Transmission & Distribution | 36,150 | 36,150 | 72,300 | 60 |
| Repair, Replacement & Rehabilitation Fund | 2,500 | 2,500 | 5,000 | 4 |
| Dam Safety Upgrades | 2,550 | 2,550 | 5,100 | 4 |
| Vehicles & Equipment (Regions & Districts) | 1,000 | — | 1,000 | 1 |
| Meters | — | 1,500 | 1,500 | 1 |
| Engineering Design | 270 | 2,430 | 2,700 | 2 |
| Engineering Supervision | 320 | 2,880 | 3,200 | 3 |
| Engineering for Follow‑on Project | 100 | 900 | 1,000 | 1 |
| Subtotal – System Expansion & Rehabilitation | 42,890 | 48,910 | 91,800 | 77 |
| 2. Public‑Private Partnership Development | ||||
| Private Operator Fees | — | 6,000 | 6,000 | 5 |
| Technical & Financial Audits | 500 | — | 500 | 0 |
| Subtotal – PPP Development | 500 | 6,000 | 6,500 | 5 |
| 3. Capacity Building & Project Management | ||||
| Training | 200 | 1,800 | 2,000 | 2 |
| Technical Assistance | 250 | 2,250 | 2,500 | 2 |
| PURC Support | 100 | 900 | 1,000 | 1 |
| Vehicles & Office Equipment (PMU/MWH) | 900 | — | 900 | 1 |
| PMU | 600 | — | 600 | 1 |
| Environmental Safeguards | 70 | 630 | 700 | 1 |
| Subtotal – Capacity Building & PM | 2,120 | 5,580 | 7,700 | 6 |
| 4. Severance Program | ||||
| Staff Severance | — | 11,000 | 11,000 | 9 |
| Subtotal – Severance Program | — | 11,000 | 11,000 | 9 |
| Unallocated | 500 | 500 | 1,000 | 1 |
| Re‑Pay PPF | — | 2,000 | 2,000 | 2 |
| PROJECT TOTAL | 57,010 | 62,990 | 120,000 | 100 |
3.3.3 A theory of change – better before than after
Theories of change are powerful conceptual tools that explain how one moves from an initial situation to a projected final situation. It goes further than the logical framework, the standard format used in project presentations to boards, which justifies that the actions implemented do in fact contribute to the intended objective (causal effect). Asking about the “how” forces one to ask: have I truly planned everything necessary to reach the objective?
The ex-post evaluation of the 2010 World Bank project uses one, employing the vocabulary of the logical framework. It judged the first two objectives satisfactorily: extending access to water and sanitation services respectively in rural communities and small towns — “the causal links between project activities, intermediate outcomes (outputs), and results are logical.” Expanding access is not, in itself, complicated if the necessary means are provided. However, for the third objective, ensuring that installations remain sustainable, “the theory of change shows gaps.” A comprehensive information system to support monitoring and evaluation by district assemblies was clearly not sufficient on its own to achieve the final objective. “The project activities did not fully address the barriers to the sustainability of water and sanitation services, except through behavior-change education and campaigns to improve sanitation and hygiene. The theory of change implicitly assumed that beneficiaries would properly maintain the latrines and that there would be adequate financing and efficient supply chains for spare parts for the maintenance of boreholes and hand pumps.”
Even more than for evaluating a project, the theory of change is thus particularly suited to ensuring the systemic approach inherent in scaling up. It is preferable to develop it at the beginning rather than afterwards.
4. Conclusion
This case study clearly demonstrates the limitations of the project-based approach, which has remained dominant in Ghana’s water and sanitation sector. Individually, the projects achieved their objectives at completion, but overall, the rate of access to drinking water has stagnated for the past 15 years and is even below the levels reached in the regions at the time the projects were completed. They failed to generate a positive dynamic, and today 9 million people in rural areas still do not have access to safe drinking water.
Given the amounts invested in this sector, these results are unsatisfactory. One could, of course, conduct a counterfactual analysis and ask what would have happened had these external financings not taken place, in order to isolate their impact, which undoubtedly remains positive. It is likely that without them the situation would have been far worse. One could quantify this additional gap in access to safe drinking water by summing the initial impacts of each project and adding population growth. However, the purpose of this analysis is not to pass judgment, but rather to draw lessons from past shortcomings, setting aside their historical and contextual causes.
Beyond the issue of donor coordination — which ultimately raises questions, even though each claims to be attentive to the actions of others — financing remained governed by the internal logic of each donor rather than by a collective objective of achieving universal coverage. This is illustrated by the World Bank’s 2010 project, solemnly presented at appraisal as the third and final intervention in the sector, even though coverage targets were still far from being achieved. It is also evident in AFD’s withdrawal from the sector after the failure of the last project developed with the EIB, which was ultimately cancelled.
As seen, this study offers many lessons. Perhaps the most important is to acknowledge the difficulty of scaling and to carefully analyse the barriers in order to dare to confront them. Throughout the projects that were designed, the stated intention was to move toward a Sector-Wide Approach (SWAp). Every evaluation since 2008 includes a paragraph on the subject. Yet it did not succeed. A thorough investigation involving all stakeholders of the time would be required to understand the reasons.
Ex post, with what we now know about scaling, one may hypothesize that what was lacking was a systemic, holistic vision. If the real objective had not been to increase access to safe drinking water in a particular region from, say, 60% or less to 80%, but rather to aim for 100% coverage in all regions, then all national and international stakeholders would have been compelled to reach agreement, to construct a genuine theory of change, and to seriously address private sector engagement. Greater motivation might also have emerged. Annex 1 of the report attempts a theoretical exercise: what would need to be done today to reach that objective?
It also appears clear that the sector never reached a sufficient critical mass in terms of national capacities. This is visible in at least two respects: maintenance of infrastructure (boreholes, pumping systems, mini-networks), which for a long time was expected to be handled by the private sector under the responsibility of district assemblies, was ultimately entrusted in 2018 to a national public company, the CSWA. Projects achieved their limited coverage objectives — 80% in the Ashanti region under the AfDB project — but ten years later coverage had fallen back to the national average of 60%. This can generate a sense of discouragement, which a comprehensive scaling approach could help counter.
What has improved today is our understanding of the mechanisms of this global, systemic approach, as will be seen in the following chapters. The elements of the method are now known, and it can already be anticipated that the key factor will be the will to begin. But first, it is important to understand that the scale of global needs requires a more mobilizing approach to financing.
Key takeaways
|
SECOND PART: RECOMMENDATIONS FOR SCALING IN ACTION
This section combines principles drawn from the experience undertaken by AFD since early 2024 on a portfolio of projects to be “scaled up,” viewed in light of theoretical principles – or at least principles theorized from a wide range of experiences gathered by the Scaling Community of Practice and notably adopted by the OECD as guidance made available to DAC member countries.
We will begin with the presentation of these general principles before examining their operational application. But first, it is worth recalling that scaling up is simply an expanded response to needs, and that it can take several forms[26]. A 2015 report by the CGET and SGMAP identified six types of scaling, which are often combined:
- Deepening (“scale deep”) – doing better what is already being done.
- Diversification (“scale out”) – doing something different from what is already being done.
- Dissemination through duplication or geographic expansion (“scale up”) – doing more of what is already being done.
- Dissemination through sharing or cross-fertilization (“scale across”) – enabling others to do what is already being done.
- Collaboration (“scale together”) – working together to do more and do it better.
- Merger (“scale by mixing”) – joining forces to strengthen the project.
Whatever the type, depending on the context, it can only be achieved through transformative actions that foster broader mobilization of funders; otherwise, efforts risk remaining within an opportunistic approach focused on identifying the right project operator.
The recommendations that follow begin with the application of a proven methodology, then address how donors should organize themselves accordingly, followed by the integration of national authorities — an apparent but essential prerequisite — and finally highlight the benefits of this more complex approach, which nevertheless opens up greater opportunities.
Recommendation 1: Change the approach by applying a proven methodology
We can start from a simple framework, already presented in the first part. To build the national scale-up of a project initially implemented on a limited scale (city or region) that has demonstrated proof of concept, three steps are necessary:
- a vision – identifying the complementary needs that can be met.
- a strategy – determining how to achieve this.
- the mobilization of financial resources – both domestic and external, public and private.
Since the scaling-up process is systemic—requiring everyone to come on board—things are naturally more complex: establishing an enabling institutional framework, strengthening the capacity of actors (both to deliver and to purchase the expanded service at national scale), and engaging the national banking system to take interest in a new clientele are a few examples of this added complexity.
| Figure 2.1: Scaling Up Management Framework
Source: Scaling Tools for Practitioners, 2021 Edition. https://www.msiworldwide.com/wp-content/uploads/2023/09/ScalingUp_toolkit_2021_v5_0.pdf |
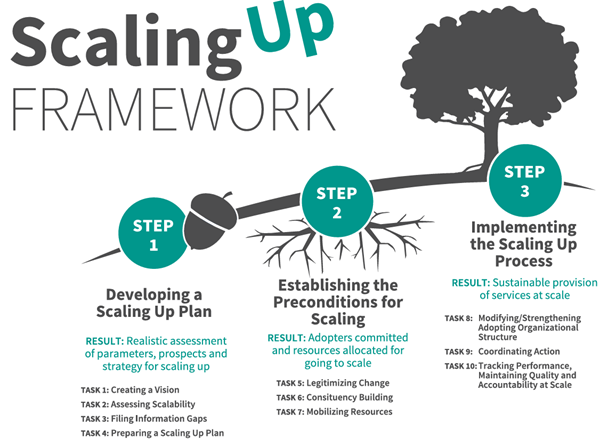
1. The vision: essential for mobilizing stakeholders
The vision concerns both the target group of beneficiaries to be reached and the obstacles to be addressed. It is very difficult to imagine the latter without at least an approximate idea of the target to be achieved. It should be noted that the project-based approach is often very precise regarding the direct beneficiaries of funding, yet we know almost nothing about the proportion they represent at the scale of the region or the country.
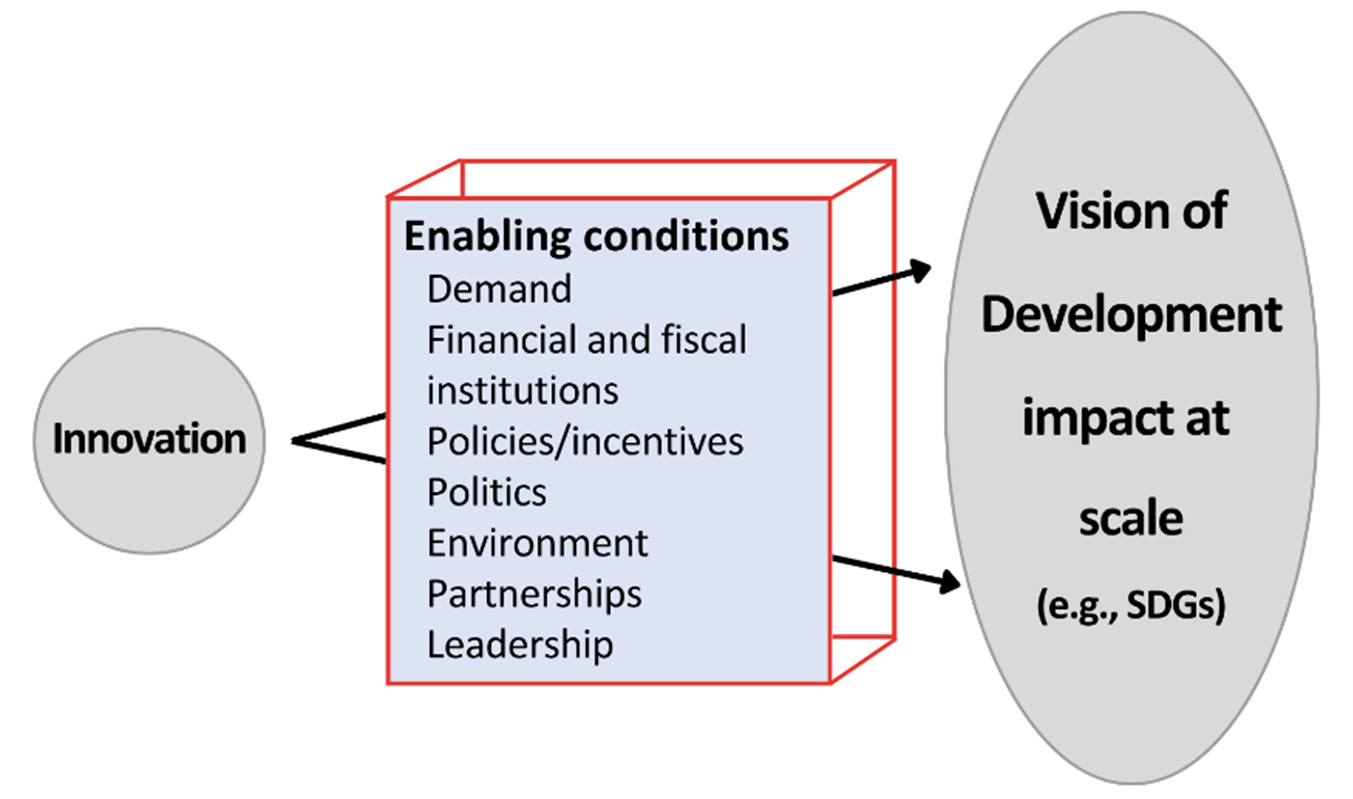
With regard to obstacles, the following diagram, taken from Hartmann and Lin (2008), provides an overview of the conditions to be addressed in the business environment. It applies equally to innovation and to the enabling environment of a project. It gives rise to an important observation in the report: the impossibility for a single actor — whether an innovator, a project operator, or a funder — to tackle the enabling environment alone.
| Figure 2.2: From innovation to impact at scale
Source: Adapted from Hartmann and Linn (2008) |
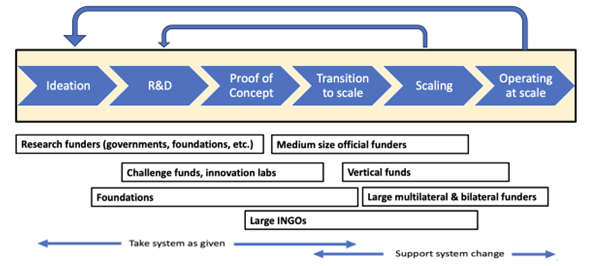
Another diagram shows, based on the six stages of scaling up an innovation, how in the early stages one can work within the existing system, but beyond a certain level of deployment it becomes necessary to consider its required evolution and the associated efforts:
| Figure 2.3: The role of funders in the six stages of scaling
Source: Adapted from IDIA (2017) |
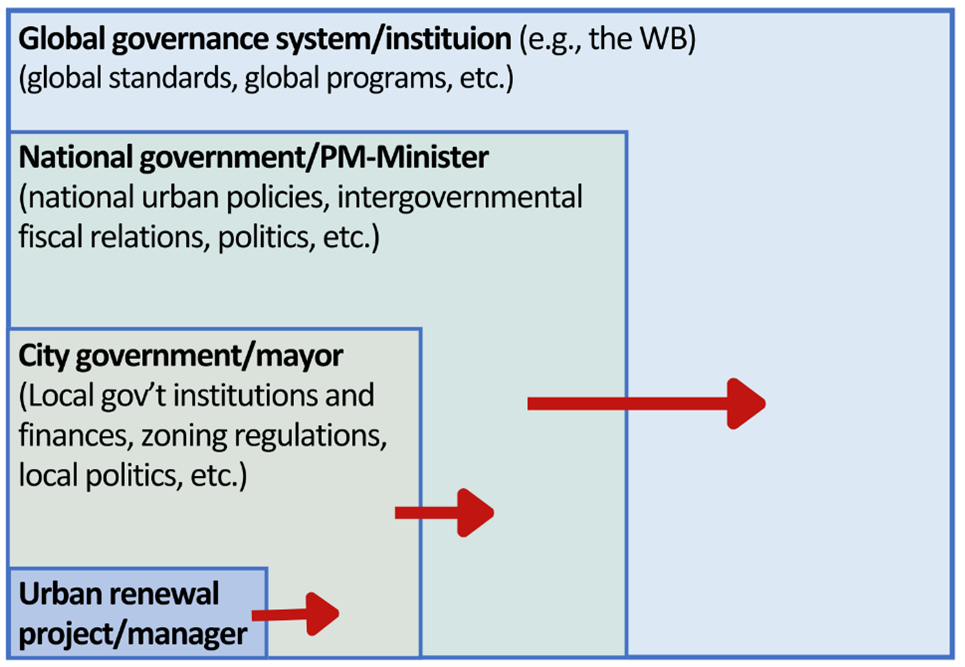
The report also presents an interesting diagram that illustrates the diversity of visions depending on the level of the actors involved.
| Figure 2.4: The scale of vision depends on who you are
Source: Cooley & Linn (2024) |
The SCoP report[27] also associates the idea of an inclusive vision with achieving optimal impacts at scale. Each of these words is important: optimal does not mean maximum, in order to account for necessary trade-offs or potential increasing costs that may outweigh expected benefits. Inclusive refers to the involvement of national stakeholders, as opposed to a vision driven unilaterally by donors from the Global North.
Other corollaries are also highlighted: the vision must be fair, meaning it should take into account potentially overlooked social groups or those who may lose out in a changing system. It is a long-term process, often taking 10 to 15 years, requiring careful ex-ante sequencing, with early and intermediate results planned in advance.
2. The strategy: organizing scaling-up
Once the vision has been defined, demonstrating impact and determining the economic model are essential foundations of the strategy before a full deployment strategy is developed. The reasons are fairly straightforward: the first questions public authorities, new operators, and their financiers will ask are: How much does it cost? What does it generate? This analysis also helps guide financing decisions: what portion is financially viable and can therefore attract private financial system funding, and what portion is not viable and should be covered by the public sector?
Two difficulties may arise: insufficient evidence of impact and the abandonment of economic analysis — the two being closely linked (the latter serving as a form of impact evidence).
In donor-funded projects, evidence of impact is often reduced to the number of people reached: number of children benefiting from education projects, number of enterprises supported through advisory programs, etc. These are known as aggregable indicators, because they have the advantage of being addable across projects. However, they do not tell us what ultimately happens to beneficiaries: does education lead to employment? Do businesses see increases in turnover or profits?
Box 1: Measuring impact for a scaling-up project: technological support for the professionalization of micro, small, and medium-sized (MSME) food processing enterprises in four Sahel countries[28]
On achieving the initial target of supporting a thousand enterprises and with strong satisfaction and positive feedback from the beneficiaries, the AFD project team sought to scale the MSMEs support project.
An economist was commissioned to estimate the value added generated by the project’s interventions and travelled to Senegal to assess a significant sample of participating enterprises. The findings exceeded expectations: based on a growth differential in turnover and value added (VA) between supported enterprises (24% average annual growth) and national statistics (7%), the additional value added generated over a ten-year period—including upstream (suppliers) and downstream (distributors) activities—showed a ratio of 1 to 30 relative to the investment in technical support. For the directly supported enterprises alone (excluding upstream and downstream effects), the ratio was 1 to 12.
With the project’s available resources, 250 enterprises had been supported, while national needs were estimated at over 2,000 enterprises. Logically, these results should encourage the mobilization of domestic financial resources—particularly public funding—given the government’s strong ambitions for entrepreneurial development. The study notably confirmed that the fiscal return would be compatible with the investment if it were fully financed by the Senegalese government.
This example illustrates the potential of such analysis to demonstrate that broader deployment is feasible. The study was conducted within a short timeframe and with a modest budget. However, the absence of baseline data and reporting systems aligned with these types of indicators required time-consuming reconstruction work that could have been avoided.
The use of evidence is the primary raison d’être of the Fonds d’innovation pour le Développement (FID), which was designed based on the work of Esther Duflo regarding rigorous impact evaluation, that earned her the Nobel Prize.
As noted in the first section, in the case of Ghana, economic analyses conducted by multilateral donors were often given limited consideration. Their gradual abandonment was examined by two AFD economists in a Research Paper and a Policy Brief published by AFD Editions (Benoît Faivre-Dupaigre and Emmanuel Fourmann – 2025[29]). The first carries a deliberately provocative title that nonetheless reflects a real trend: ‘Economic analysis, fit for the scrap heap?’ (In French: L’analyse économique à jeter aux orties?)
Drawing on a definition from France Stratégie (2023), economic analysis helps, among other things, “assess the benefits of an investment for society by analysing the welfare gains and the costs it generates for the community.” Project economic analysis (PEA) also quantifies how the value created is distributed among stakeholders (who benefits most? are there any losers?). It measures the value (where possible in monetary or monetized terms) i.e. the costs and benefits for each stakeholder involved.
Developed during the Cold War and widely used until the 1980s, this evidence-based approach subsequently declined for multiple reasons: theoretical debates regarding methodology, as well as the growing number of cross-cutting analyses required for decision-making (climate impacts, biodiversity, gender, compliance). These additional requirements led to trade-offs, particularly in a context where the beneficiary country’s decision was increasingly viewed as sovereign and therefore not subject to external economic arbitration.
It is important to bear in mind that while economic analysis may be less critical when a donor finances the bulk of a project, it becomes indispensable when scaling up.
3. Financial mobilization: applying the principle of subsidiarity
When transitioning from a project predominantly financed by an external donor, say with funding of 100, to addressing needs at the national level or operating at significantly greater scale, whether 1,000 or 10,000 instead, the role of external financiers necessarily becomes more limited. At such scale, they can no longer serve as the primary source of funding but must instead act in a catalytic or complementary capacity. The domestic financial system must assume a leading role, mobilizing public and private resources at scale. Accordingly, the function of donors must evolve: from direct financiers of isolated projects to enablers of systemic financing, leveraging their resources to crowd in and strengthen local capital flows. This can be illustrated by the following diagram:
| Figure 2.5: Subsidiarity in action for scaling
Source: Author |
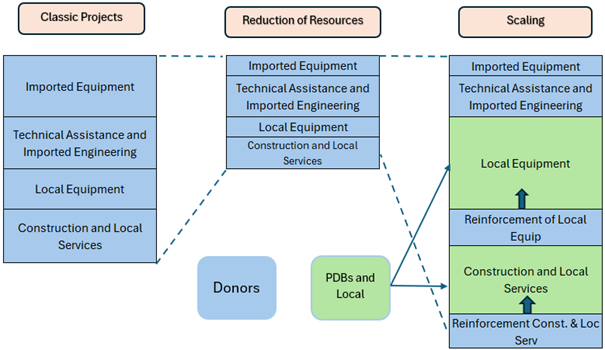
In a traditional project, the donor will finance most of the costs, whether in local or foreign currency. As we saw in the Ghana example: local financial contributions ranged from 0 to 10%. With reduced funding, the traditional approach is likely to remain the same, accepting a reduction in scope and impact. The only way to increase them significantly (scaling up) is to stop directly financing local equipment and services and instead strengthen the capacity of the local sector in terms of equipment, goods, and services, which can be financed by public development banks and the local financial system. A real paradigm shift is taking place in the way needs are financed.
The Seville conference in June 2025 (FFD4) aimed to establish a renewed global framework for development finance, noting in its preamble that “the gap between our sustainable development aspirations and the financing to mobilize to realize them has continued to widen.” Among the many solutions identified[30], domestic public resources come first, and it is affirmed that national development banks “also have a crucial role to play” alongside national financial sectors. National development banks receive three short paragraphs in the 51-page document, with i) a recommendation to strengthen their capacity, ii) through international support, and iii) by reinforcing alignment between their mandate and national regulation. On the national financial sector side, the creation of capital markets (private equity, thematic bonds, etc.), technical assistance to strengthen capacity, and the establishment of risk management markets are mentioned.
The Finance in Common coalition[31], which brings together the 530-plus development banks worldwide, prepared a more substantial support document for the summit, arguing for an ambitious framework capable of making them “SDG enablers” (aligning their status with this objective), integrating them into a harmonized architecture at scale — countering current fragmentation (synergies among multilateral, regional, and national banks) — and strengthening their capacity, with these three objectives summarized in 20 recommendations. Their advantage is prioritizing public policy goals over shareholder profit. It is important to keep in mind a varied typology, including those with mandates defined at multinational, national, or subnational levels; those that are not banks but fulfil a mission (guarantee or investment funds); and those with a universal commercial mandate. They manage 23 trillion in assets and finance 12% of investments worldwide.
| Box 2: The role of local banks in scaling up and the challenges to overcome
AFD piloted and, together with other donors, supported for around twenty years the development of rice–fish farming (integrating aquaculture into rice cultivation) in Guinea (Conakry). In practical terms, this involves stocking flooded rice paddies with fish, an approach that requires technical know-how and modest investment, often carried out directly by farmers themselves (raising dikes, installing drainage outlets, creating fingerling ponds, etc.). The most recent project (2010–2014) enabled the establishment of 3,000 rice–fish farmers, strengthened the value chain (public oversight, advisory cooperatives), and explored expansion beyond Forest Guinea, the historical stronghold of this activity. Rice–fish farming is widely recognized as a tool for food security. It generates additional income in one of Africa’s poorest countries, both through the production of animal protein and through a 50% increase in rice yields. The review of the impact assessment conducted by a consultant at the end of the project made it possible to define a reasonable scale-up target across four regions—approximately 30,000 farmers. It also demonstrated that professionally executed investment over a short timeframe generated sufficient returns to justify commercial bank financing. A follow-up mission to examine scaling conditions met with two Guinean commercial banks. The prospect of a new market — 30,000 potential clients and an estimated €60 million credit portfolio, significant at the national level — clearly attracted their interest. They immediately considered the possibility of risk-sharing mechanisms and upgrading their information systems to support such expansion. This example illustrates both the feasibility of scaling and the evolving, subsidiary role of the donor. AFD had completed a €10 million grant and was no longer in a position to continue financing at that level nor at the scale implied by the newly identified potential, especially given that demonstrated profitability opened the door to alternative domestic financing. The priority thus shifted toward supporting local banks in taking over. It is worth noting, however, that one year after the banks expressed their interest, no concrete action had materialized. One must recognize that for a bank, entering a new client segment — as is often required in scaling-up processes — is far from straightforward. Client-facing teams tend to be conservative by nature. They require both a strong managerial signal and appropriate analytical tools to assess credit applications according to standard procedures. At every level, risk culture remains central. A thorough assessment of the new market’s business potential including expected volumes, operational and investment costs, credit appraisal processes, refinancing conditions, pricing strategy, and balance sheet implications may be necessary before a genuine commitment is made. Even then, experience shows that satisfying all these conditions on paper may not be sufficient. In such cases, progress may depend on gentle political pressure from the government or the entry of a new competitive financial actor capable of shifting market dynamics. |
The mission also met with certain other traditional external donors (European Union, JICA, Enabel) and the Rio Tinto development fund. Here too, the prospect elicited interest — which in itself was a lesson on the usefulness of devoting time to such meetings. The condition, however, was patience, as these institutions’ commitments were programmed over the following two years. The expected support would be more in areas that local banks cannot finance: intangible financing (training of fish-farming technicians) and continued support to the value chain — thus a role different from covering all components of a project.
Recommendation 2: Get organised
In 2025, it has been five years since AFD began experimenting — aiming toward institutionalization — with the approach of supporting the scaling up of projects. The progress has been documented in detail as a case study of the mainstreaming process undertaken by the Scaling Community of Practice[32]. It outlines several essential operational components. As the process is still emerging, the objective is to demonstrate its feasibility, both through the successes achieved and the challenges that must be overcome.
1. Building a portfolio of experience
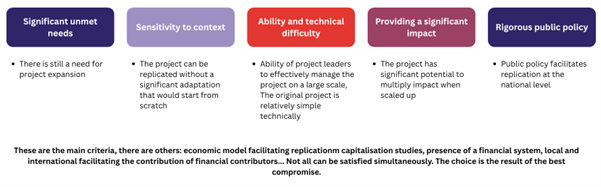
The initial finding that three out of four projects have scaling potential does not mean that all have the same degree of ease in expanding, and given that this was a pilot test, the most difficult projects were not prioritized. To select “easier” projects, acknowledging that the term is highly reductive, a grid of criteria was established (see box). No project met all of them, so the grid served as a selection tool, with different weightings applied depending on the project type (those with economic profitability versus those with a stronger social orientation).
| Figure 2.6: Criteria for scaling project selection
Source: Beugnot (2025) |
The targeted projects were those recently completed or nearing completion in 2024, the test year, and those approved between 2019 and 2021. The search was conducted in several ways: as a priority, and ideally, on the proposal of technical or geographic divisions (agencies and country managers at headquarters). But since they were not always available, and to avoid coming empty-handed to discussions, prior exploratory work was often carried out in advance by reading the files submitted to decision-making bodies, by sector or country. The risk was finding out that the project had not lived up to its promises, but this frequently led to a rebound: “This project didn’t work very well, but you should look at that one.” It turns out that asking operational teams for an “instinctive” recommendation on a scalable project is often more effective and better preserves their availability.
2. Developing the vision through a concept note
Based on this selection, a meeting is organized with the project operator, the contracting authority, or the technical assistance teams which have the on-the-ground knowledge. They can more readily indicate where the initial project can be extended and under what conditions. If they are willing (which is usually the case), the aim is to jointly build a concept note on scaling up (vision, strategy, financing needs). The concept note formalizes the intent and records everything we know and everything we need to find out through additional studies. A pedagogical template was developed to make the task easier. The spirit of the exercise is to begin by imagining that we have an unlimited budget, which allows us to explore the widest possible range of options. At an intermediate stage, a short summary sheet can be prepared, with minimal information, to initiate an initial fundraising effort, for example, to carry out a more in-depth feasibility study.
Two lessons emerged. The first is the tension between the desire to broaden scaling in light of needs and what the operator feels capable of doing, which tends to narrow ambition — especially when dealing with an NGO. Vision development often coincides with discussions about a project’s subsequent phase, and the operator tends to remain within the well-entrenched, comfortable habit of the repeat deal, with a limited replication vision. It is difficult to envisage going beyond an expansion of one to three times the initial scope. The apprehension about multiplying by 10 or more is understandable as the approach is entirely new. But there is sometimes a deeper reason: such an expansion would potentially require the interlocutor to change organization or even role, shifting from operator to advisor to other dispersed operators. A consulting firm in France has been identified to support organizations that need to adapt to change scale (scalechanger.org); their involvement proves useful.
Several projects in the portfolio did not move forward due to the difficulty of developing a vision that reflects what one might imagine for national-scale implementation. It was explained that numerous obstacles stood in the way: local context specificities, actors’ capacities requiring a long preparatory effort. While this may be true, it is precisely the role of the strategy stage of scaling to work through how to overcome these hurdles — not to let them constrain the vision itself.
In some cases, the potential for deployment could be inferred from evaluations or impact reports produced (see the case of aquaculture in Guinea) or from government reports when the intervention was framed within a sectoral logic; in such cases, the information was available; it just had to be found. In other cases, a market study was conducted.
| Box 3: Engaging a consultant to develop a scaling-up vision
For an urban infrastructure project in Turkey led by a municipality, a study was commissioned to a Turkish consultant to assess demand among just over 30 metropolitan municipalities (with populations exceeding one million). The idea was to see if there was a real opportunity for replication beyond the funded project. Through cross-analysis of reports and interviews, the study found that roughly half of these cities could address the issue through alternative solutions, while the other half appeared potentially interested in the proposed investment. Within this group of around fifteen municipalities, at least five considered themselves ready to undertake the investment, while the others required technical and financial capacity strengthening. The study cost less than $50,000 and was completed within a few weeks. |
The second lesson confirmed conclusions drawn from the international literature on scaling, namely that the process is long: several months may pass between the initial exchange with the operator and the delivery of a finalized concept note, often after several back-and-forth iterations. Despite explanations and provision of a concept note template, misunderstandings persist because one is stepping outside the usual frame. Another reason for the delay is that the work requested of the operator, even if they want to do it, is in addition to running the ongoing project and is undertaken in spare moments.
3. Getting started with a dedicated team
With a clear approach and the will to carry it out, it is difficult, pragmatically speaking, to begin without forming a dedicated team. The World Bank, ten years after its creation in 1946, recognized the need to engage with private-sector financing and created the International Finance Corporation (IFC). AFD followed the same path in 1977 with the creation of Proparco. Although AFD had financed private-sector development since its founding, this small subsidiary was a recognition of the need for a distinct approach with its own means.
The necessity of a unit dedicated to mobilizing financing was also confirmed by another World Bank experience: the Bank once had a dedicated co-financing team, but when it was disbanded during a reorganization, co-financing volumes immediately dropped—showing that such an independent unit was indispensable.
Within AFD, the implementation of the scaling-up initiative under the innovation unit, itself part of the directorate also in charge of strategy and research — thus outside the core operational sphere — stemmed from the observation that project teams did not have enough capacity to both manage and follow up on current projects and handle the added complexity of scaling up. Even with a clear methodology, asking them to take on an additional, more complex dimension was far from reasonable[33].
While the scaling-up approach shares some components with project management (such as conducting market studies or seeking co-financing), it is closer in nature to a facilitator’s role—connecting newly identified beneficiaries capable of replicating the original project with potential financiers. In other words, it represents a distinct profession, one that properly acknowledges and values the contributions of each party.
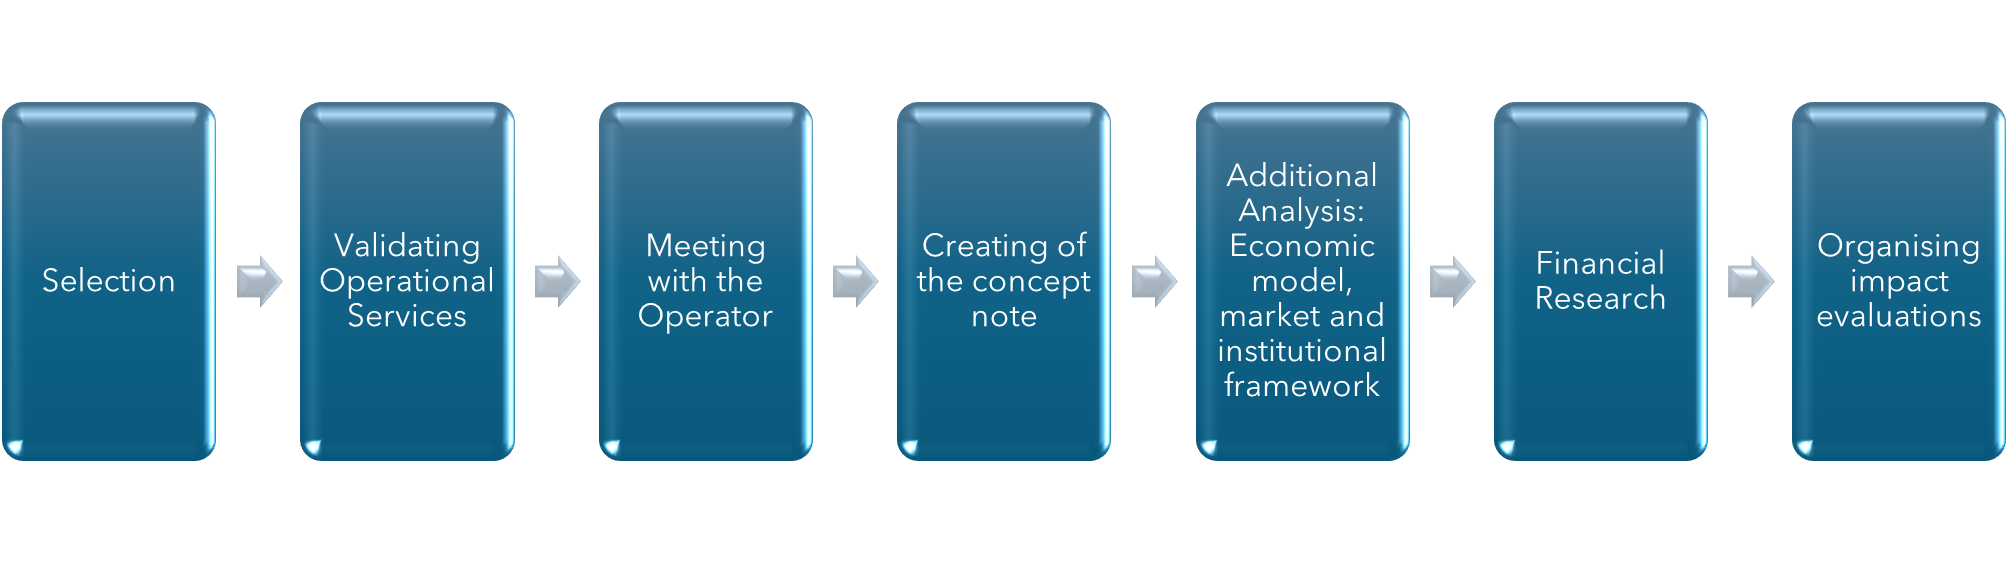
In the business world, there exists the function of the arranger, who identifies financiers and conducts contractual due diligence. The scaling facilitator would not go as far as handling contractual matters but would instead work further upstream, helping define a project or program with broader impacts before the financing phase. Initial experience has assigned the facilitator the following functions:
- As custodian of the methodology, the facilitator works in synergy with project teams to develop the scaling-up methodology from successful projects and their follow-ons. Experience shows that teams value this collaboration, as it gives their project greater perspective.
- Acts as a coordinator for required studies: market analyses, impact assessments, economic analyses (drafting TORs, contracting, monitoring).
- In cooperation with existing mobilization teams[34], ensures outreach and advocacy with potential financiers through to completion.
- Organizes impact measurement and reports on it.
These functions are summarized in the figure below.
| Figure 2.7: Steps of expansion through co-financing mobilization
Source: Author |
We will see in the following subsection that this dedicated team can rely on a sustainable economic model.
4. Build on the SCoP and pool experiences
The Scaling Community of Practice (SCoP) was briefly introduced earlier. This international, informal community serves as a forum for debate and exchange, accumulating over a decade of valuable experience and knowledge capitalization on scaling-up methods and case studies. More recently, it has conducted an institutional mapping of how the scaling-up approach is positioned and implemented across about fifteen organizations—traditional bilateral and multilateral donors, vertical funds, and major international NGOs. This mapping represents the first step in a broader mainstreaming process, aiming to institutionalize scaling-up practices across the entire development ecosystem.
The results of this mapping show that much remains to be done. The following chart illustrates how scaling-up is currently positioned within the organizations studied by the SCoP:
| Figure 2.8: Funders placement on the mainstreaming spectrum
A note of caution: on the right side of the chart we mostly find vertical funds, while the traditional donors including AFD are positioned more to the left. Source: Adapted from Sabine Junginger, 2009 https://www.researchgate.net/publication/266281802_PARTS_AND_WHOLES_PLACES _OF_DESIGN_THINKING_IN_ORGANIZATIONAL_LIFE |
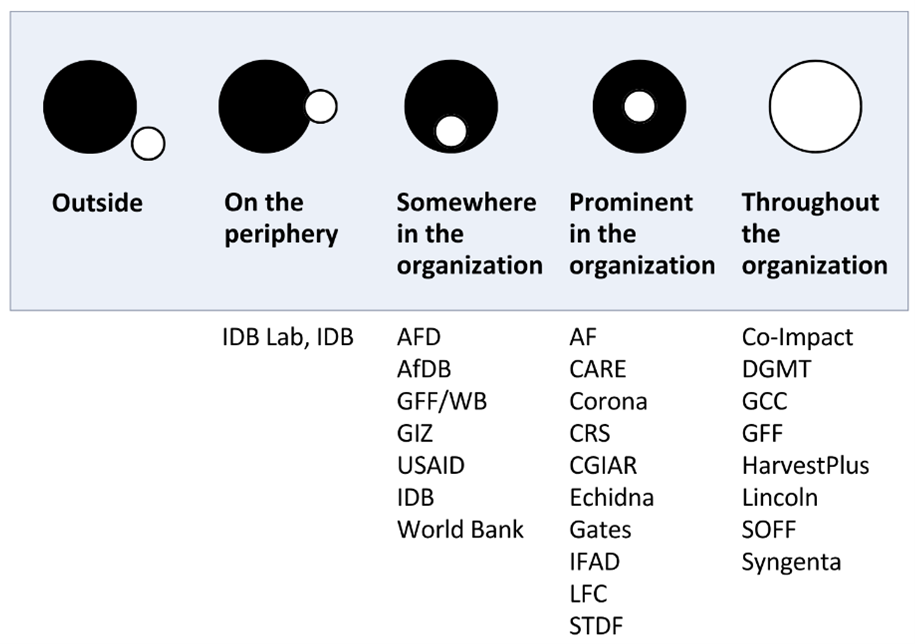
The purpose here is not to make an inventory of everything that has already been done (their website is already very well supplied), but rather to make a case for development financiers to support this mechanism structurally and financially, since they could make even greater use of it.
As we have seen, scaling up is a complex issue that cannot be handled by a single organization, no matter how powerful it may be. It involves mechanisms that are still emerging in their design, such as country platforms. Taking this last example, the international community of financiers needs to learn quickly and cannot afford to wait ten years for a complete evaluation. The effort to raise awareness among the 530 public development banks about this new approach could also be carried out, at least in part, by the SCoP, which is at the forefront of this field of expertise. Another major undertaking is to develop a rigorous methodology for measuring impacts. Building an investment-friendly environment through collective action is a context quite different from that of a single project, and it is crucial that each contributor be able to account for their results: What triggered the scaled-up impact — their own involvement or that of others? What is the measurement baseline? When and for how long should the impacts be measured? And so on.
Scaling up represents a major investment in preparing the ground for financing that will come from multiple sources, in which traditional development financiers will play only a subsidiary role. For reasons of efficiency, they have every interest in relying on a structure that already operates largely on the commitment and voluntary work of its members.
Recommendation 3: Engage national authorities
As observed in the exploration of the Ghana case, the implementation of aid by national authorities was far from systematic. Their involvement becomes indispensable when steering a national-scale rollout.
A country platform (CP) can be an effective means to manage an undertaking of this magnitude. This is an emerging concept developed to respond to the challenge of mobilizing and aligning resources toward ambitious climate and development goals. Although there is no universal definition, a country platform generally refers to a nationally led mechanism that brings together diverse stakeholders—public authorities, development partners, national and international financiers, the private sector, and civil society—around a common investment agenda.
One of the first major proposals for country platforms came from the G20 Eminent Persons Group on Global Financial Governance, which sought to improve coordination among international financial institutions at the country level (Gilmour et al., 2025).
Box 4: The G20 Reference Framework for the design of country platforms:
Reference: G20 Saudi Arabia (2020). G20 reference framework for effective country platforms. https://wjb.mof.gov.cn/ywwz_14955/Cooperation/mulid/202011/P020201104581749367491.pdf |
Unlike traditional, project-specific aid, CPs emphasize programmatic, multi-year portfolios that blend financing instruments, sequence policy reforms, and shift decision-making closer to national systems (Gul et al., 2025).
The Just Energy Transition Partnerships (JETPs) in Indonesia, Senegal, South Africa, and Vietnam (first launched at the COP26 in 2021) were among the first operational CPs. Since then, several countries have adapted the model, expanding its scope to cover multiple sectors (Kelly & Papoulidis, 2022). In total, more than 40 countries are now exploring country-platform-like arrangements (Gilmour et al., 2024). Ghana itself has embarked on such an approach.
| Box 5: Ghana’s Climate Prosperity Plan as an example of country platform
At the COP29 in Baku in November 2024, Ghana launched its ambitious Climate Prosperity Plan (CPP) that sets out a roadmap to go from climate vulnerability to climate prosperity. While not officially termed a country platform, the CPP is anchored at the highest national political level and aligned with Ghana’s development goals. The CPP aims to bring in investments in renewable energy, sustainable infrastructure and climate resilient policies. By being structured as a mechanism to leverage public-private partnerships and innovative finance to advance Ghana’s climate prosperity, the CPP meets the characteristics to be termed a country platform. Ghana’s Climate Prosperity Plan is centred around two principal goals: Climate Secure Ghana and Climate Prosperous Ghana. Each goal has specific further objectives with milestones every 5 years. The goals are also supported by a number of keystone projects that aim to launch a wider pipeline of over 130 projects. The total resource mobilization associated with the Plan is announced at USD 76.2 billion, with an initial investment window of USD 17 billion by 2030. The financial model combines public budgets, development finance, private capital, and risk-transfer instruments, supported by carbon market revenues and results-based allocations. This blended finance structure aims to leverage private investment, strengthen fiscal resilience, and expand access to green financing. Under the “Climate Secure Ghana” target, 100% of Ghana’s population is expected to have access to at least basic water services by 2030, through a “Sustainable Safe Water and Sanitation Improvement Project” of USD 198 million, designed to expand basic water facilities to 53 communities and 150 schools. In light of what has been discussed, this figure seems low and will need further analysis. |
Recommendation 4: Recognise the benefits of scaling up
As we have seen throughout the implementation recommendations, the matter is more complex than a single project. Yet, national-scale scaling up opens possibilities far greater than those of a project. At the country level, these seem obvious: meeting the expanded needs of the population, increasing the supply of goods and services that form part of the business environment, and thereby fostering endogenous development. We will begin with this opportunity before highlighting three others that are more specifically aligned with the interests of donors.
1. A sustainable local credit supply
Here we address a technical subject that is necessary to be understood for overarching coherence on this subject. Insufficient national savings is often cited against scaling ambitions. This would leave only recourse to foreign funds, which becomes an insurmountable constraint and contrary to the spirit of the approach. Another way of reasoning is to rely on a Keynesian approach in which money is considered an endogenous rather than an exogenous variable, and where controlled money creation can generate the missing liquidity, according to the traditional adage: loans make deposits. On paper this works, as shown by two EIB economists using a simplified model (Massimo Cingolani & Eugenio Leanza, 2025[35]).
Since money creation is now dematerialized, its main source is credit granted by the banking system to other economic actors — households, administrations, firms. Regulation of the money supply is carried out through regulatory ratios, reserve requirements, and banks’ access to central bank refinancing to meet those ratios. Loans received by firms allow the purchase of goods and services and the payment of wages to carry out their activity. Sellers of goods and services and employees deposit the sums received in their bank accounts; firms repay their bank loans; the circuit is closed. The economic activity generated by the loans is, at least in part, created ex nihilo, provided that the supply of goods and services is domestic. Developing local supply, rather than relying mainly on imported goods and services, is a key challenge for scaling up.
In fact, the necessary condition for this scheme to work is that there are not (too many) “leaks” in the system: if loans finance spending outside the national territory, money creation generates a current account deficit in the balance of payments. This results in distrust of the national currency and depreciation of the exchange rate against foreign currency. Similarly, if loans finance operations with no economic return, the loans will not be repaid and banks’ positions will be compromised.
Fundamentally, banks must be able to act on money creation, which is not necessarily the case for certain public banks whose model is financial intermediation: they re-lend, with a margin, amounts equivalent to what they have borrowed and do not take deposits. In themselves, these two conditions are not prohibitive if their credit with other banks is sufficient to allow them to borrow without difficulty (via bond issues or standard loans) and if the induced deposits flow to other national banks.
In summary, if these three conditions are met — i) banks’ capacity to create money; ii) use of loans for productive activities generating economic growth; and iii) capacity of the local sector to respond to the surge in demand — then a positive dynamic can be generated by money creation, which greatly reduces or eliminates[36] the prerequisite of prior savings.
This third condition (capacity of the local sector) was addressed in the Ghana water-sector case study. We saw that private-sector involvement was considered crucial, but without genuine support, and it was overlooked in the final evaluations. We also saw that multilateral donors used to analyze the local versus foreign-currency share of project costs; this analysis constituted an initial assessment of local firms’ ability to participate in the project, to strengthen it, and should have been used to calibrate the share of external foreign-currency inputs based on a subsidiarity principle.
Ultimately, scaling a project nationally can offer the advantages of a business volume large enough that, within a systemic approach:
- attention is paid both to end beneficiaries (the population served) and to suppliers and subcontractors;
- expected (macro)economic effects are assessed ex ante to justify money creation via credit supply;
- and the latter is controlled by the prudential authority,
all of which are much harder to envisage within the restricted scope of a single project.
2. Promoting enterprises from the donor country
Whether aid is tied or untied, there is always a political expectation — explicit in the first case, implicit in the second — that public spending in the form of grants or concessional loans should also benefit related national enterprises. This is true for both Northern and Southern countries (China, for instance). Even when project selection, design, and tendering processes aim to meet this objective (e.g., through technical specifications in the terms of reference), the expectation is sometimes unmet. The main reason is often the small size of projects.
Bidding companies are reluctant to make substantial investments given the administrative procedures and country risks (such as capital transfer risks), despite the home country’s support mechanisms. In AFD’s case, under untied aid[37], a positive correlation has been established between project size and the rate of participation of French firms in the awarded contracts.
This is not surprising, since the success of a project often depends on the partnership between a local company and a foreign one providing technology. Larger investments encourage such partnerships, with a longer-term impact that goes beyond the simple supply of goods or services. They create enduring relationships that foster local investment — either by requirement or mutual benefit — and enable technology transfer and trust-building.
3. Moving beyond a competitive environment among donors
Despite the rhetoric of harmonization — and despite co-financing arrangements — the project logic still drives donors to seek reliable local counterparts, which are rare (the well-known “absorption capacity” problem). This situation encourages competition among donors.
By contrast, a scaling-up approach, oriented toward actual needs, seeks to broaden the financing landscape by strengthening local actors’ capacities and, more generally, by creating an enabling environment for investment. Scaling up thus compels donors to work together to reinforce all dimensions of this environment, since no single donor can succeed alone. It also provides them with a broader operational field for future interventions.
4. Relying on a sustainable economic model
The current adverse context for investment financing in the Global South — and the widespread criticism of traditional aid — poses a challenge for establishing a new professional role: the scaling-up facilitator, and by extension, dedicated teams. Recognizing the need for a different approach is not enough; a sustainable financial model must also be developed.
Since AFD, as a financial institution, must balance its accounts (as do most institutions), this facilitator function should aim for at least partial cost recovery. However, this principle can apply broadly. The reflections below outline how sustainability could be achieved based on three assumptions:
- Assumption 1: The cost of replication (scaling) is lower than that of the original project, while the impacts are multiplied.
- Assumption 2: The facilitator, by enabling new projects to materialize (catalytic effect), can claim partial credit for the resulting impacts without bearing all investment costs. While accounting for these impacts differs, their scale is genuinely multiplied.
- Assumption 3: Once proof of concept is achieved, it should be possible to sell impact outcomes to specialized funds to finance the facilitation tool itself, since the cost per unit of impact is lower than that of an original project.
In steady-state operation, the facilitation mechanism would thus have two sources of funding:
- Facilitation fees, charged to connected financiers whenever possible. The multiplier effect would keep the unit fee modest. A simple calculation for the replication of an infrastructure project suggests a facilitation fee of 0.15% of total investment cost, absorbed within the financing rate.
- Contributions from impact-driven funds. Based on the tool’s experience, such contributions could be calculated in proportion to the expected impact volume, allowing funds to assess the comparative advantage of the tool.
Important note: The costs of preparing a scaling-up process can be minimized if this perspective is built into the initial pilot phase. The additional investigations are relatively minor — if, when conducting a sector study (often the first part of evaluation reports), one looks slightly beyond the project’s original boundaries. Most importantly, including impact indicators early on makes it easier to convince other actors later, avoiding the need for costly ex-post studies, as noted in Box 1 regarding the economic study in Senegal.
CONCLUSION
Three major points developed in this paper deserve to be highlighted again: accepting a different logic opens up a new field of opportunity, it is feasible despite its greater complexity, and ultimately it reshapes relationships for the benefit of all.
- Scaling up does not oppose the project; it extends it. The project remains the essential experimental ground. One must accept a different logic, in which additional funding beyond the initial allocation serves a single purpose: preparing the ground for other financing (i.e. catalytic mobilization), that can meet needs “at an entirely different scale.”
This different logic introduces a more complex and longer process, but one that opens up a universe of opportunities impossible to imagine within the limited scope of a single project. For instance, one cannot hope to achieve full water coverage in a country, or a sustainable transport system where it is lacking, without first building the upstream equipment and maintenance industries. These industries, in turn, generate endogenous development processes, making sustainable domestic financing possible and increasing attractiveness for foreign investment.
- Complexity is paradoxically what makes scaling up feasible. It reflects the complexity of the world we must confront. Today, we can no longer address climate issues without considering biodiversity and inclusion. Globalization and humanity’s common goods have made us aware of a more systemic dimension of challenges than we could have imagined twenty years ago. Tomorrow, no project will be financed without considering the transformation of the system that supports it.
This means that the entire international community must embrace this way of working: traditional Northern donors, Southern public development banks, private financial systems in both North and South, governments, etc. That is the purpose of this paper: to share early experiences alongside many others produced by the Scaling Community over the past ten years. For a long time, challenges in development were often unilaterally attributed to recipient countries under the label of “absorptive capacity”: the money was available, but could not be spent. Responsibility is now recognized as collective.
- Operational implementation of scaling up requires the engagement of all actors.
Efforts must unite around very concrete objectives i.e. the projects themselves, toward other concrete goals i.e. the needs of populations. Scaling up benefits everyone: it establishes a new relationship, as envisioned in Seville, between funders and recipients, moving toward a logic of solidarity and sustainable investment which are significant investments combining public and private, domestic and international resources, for a shared future benefit.
It creates a new relationship among donors themselves, each dependent on the others. Finally, it establishes a new relationship between public donors and their principals, supported by partnerships that will benefit enterprises, local governments, and civil society through the opening of new opportunities.
Annex 1 – Applying the method and experience: What could be imagined for the rural water sector in Ghana
It is a delicate and risky exercise to project on paper the ambition of effectively meeting the drinking water needs of 9 million people, especially after decades of effort without achieving full coverage. At the same time, it can seem somewhat pointless to present a method for scaling up without testing it against a problem of national significance and a meaningful Sustainable Development Goal (SDG). Let us be clear: the objective here is modest. The aim is primarily to lay out some simple foundational reflections, as was done in the concept notes discussed in the previous chapter, to stimulate reactions and further discussion with Ghanaian authorities as a priority. This exercise will also address overall governance with a concept that appears important: country platforms.
1. Implementation of the Approach
We can start with an overview that integrates the fundamentals of the methodology — vision, strategy, and financing mobilization — to grasp the systemic nature of such an undertaking. The approach will be developed progressively, moving from concept verification to pre-feasibility, then feasibility, identifying along the way what is known, what is unknown, and what investigations remain to be conducted.
1.1 Vision
The first step is to develop a maximal vision for coverage, assuming unlimited resources. This theoretical exercise sets a horizon and allows early consideration of necessary resources (particularly organizational) as well as the economies of scale it enables. Achieving results sequentially without a vision differs significantly from doing so with one.
In a second phase, a phased implementation plan will be developed. It is important to remember that the logic of scaling up always starts with needs rather than the resources of funders. Questions also arise regarding whether to address both water and sanitation, which are often linked; specialists will determine this, but it would obviously be simpler to begin with water alone. To do so, an inventory should be conducted:
- The needs to be met, by type of equipment — boreholes, pumps, networks, etc. — both for rehabilitation and new construction, broken down by region and village.
- The enterprises and service providers available; identify gaps and capacity-building needs, prioritizing local provision to maximize both economic impact through employment and sustainability.
- An assessment of the cost of these needs, which will vary depending on the scale under consideration — unit costs differ — and should follow a physical inventory. This assessment should distinguish between local currency and foreign currency requirements, always aiming to minimize the latter.
1.2 Strategy
Once the vision is established, developing a strategy fundamentally involves asking how it will be implemented:
- What is the capacity of existing actors — both state (from central administration to the CSWA) and non-state (local private sector enterprises providing equipment and maintenance) — to carry out the deployment process?
- What capacity-building needs exist to create or strengthen supply where it is lacking, and to reorganize existing structures to handle the scale of the undertaking? If the strengthening is extensive, consider whether partnerships with foreign groups could help.
- Conduct a broad assessment of the economic effects of such an investment, setting aside social or political effects. This evaluation, highlighting a partially self-sustaining dynamic, will inform thinking on national financing, in line with the macroeconomic reflection developed in the previous chapter.
- The probable need for a national coordination platform, as discussed further below.
- A coherent theory of change to ensure overall consistency. For example, this should check whether resources outside the water sector are required: for instance, access to electricity for water networks, security in northern regions, the presence of a local banking network, etc.
1.3 Financing Mobilization
Priority must be given to the local financial system, given the expected scale of needs. This also begins with several inventories:
- Financing requirements by purpose: enterprises, administration, equipment, services (including capacity-building), by type of instrument: equity, loan (profitable portions), and grant (non-profitable portions), distinguishing local currency from foreign currency.
- The local financial system’s capacity to meet domestic needs and its capacity-building requirements; consider applicable financial innovations that could be deployed.
- Ongoing and planned interventions by external donors.
- Explore whether part of the foreign currency needs could be provided by banks or capital funds, especially where partnerships mentioned above cover part of the demand.
All these elements will be brought together to develop an overarching vision, which can be built progressively — starting broadly and then narrowing as stakeholder buy-in grows and operational implementation becomes feasible. A country platform can be a way to effectively lead a project of such magnitude (cf. part 2 Recommendation 3)
[1] https://www.orfonline.org/research/bridging-the-financing-gap-for-the-sdgs-a-framework-for-renewed-action
[2] OECD (2025), “Cuts in official development assistance: OECD projections for 2025 and the near term”, OECD Policy Briefs, No. 26, OECD Publishing, Paris, https://doi.org/10.1787/8c530629-en.
[3] The costs of achieving the Sustainable Development Goals | UN Trade and Development (UNCTAD)
[4] https://unstats.un.org/sdgs/report/2025/
[5] Rozenberg, Julie; Fay, Marianne. Beyond the Gap: How Countries Can Afford the Infrastructure They Need while Protecting the Planet (Vol. 1 of 2) (English). Washington, D.C.: World Bank Group. http://documents.worldbank.org/curated/en/189471550755819133
[6] www.who.int/news/item/17-07-2017-who-estimates-cost-of-reaching-global-health-targets-by-2030/Under%20the%20%22ambitious%22%20scenario%2C,%2458%20per%20person%2C%20by%202030.
[7] UNIDO and FAO. 2024. Ending hunger is possible: An income-generating approach through value addition. Vienna. https://doi.org/10.4060/cd2942en
[8] Vitor Gaspar, Mercedes Garcia-Escribano, Delphine Prady, and Mauricio Soto. “Fiscal Policy and Development: Human, Social, and Physical Investments for the SDGs” 2019, https://doi.org/10.5089/9781484388914.006
[9] Bhattacharya et al. (2023[45]), A Climate Finance Framework: Decisive Action to Deliver on the Paris Agreement –Summary, https://www.lse.ac.uk/granthaminstitute/publication/a-climate-finance-framework-decisive-action-to-deliver-on-the-paris-agreement-summary/
[10] United Nations, Inter-agency Task Force on Financing for Development, Financing for Sustainable Development Report 2024: Financing for Development at a Crossroads
[11] “The responses provided by the international community today are fragmented, partial, and insufficient.”
[12] “Growing fragmentation is also increasing transaction costs and runs counter to long-standing effectiveness principles” Outcome First draft p. 10. Dans ce même chapitre, en page 12 on trouve un plaidoyer pour une part plus grande des multilatéraux et des fonds verticaux : “We will reduce fragmentation, including by prioritizing core contributions to multilateral institutions and multi-donor and inter-agency pooled funds, and by utilizing the respective strengths of both horizontal providers such as MDBs that can leverage their capital and vertical platforms”.
[13] Understanding Trends in Proliferation and Fragmentation for Aid Effectiveness During Crises (WB July 2022)
[14] The International Aid Transparency Initiative (IATI) was launched in 2008 during the Third High-Level Forum on Aid Effectiveness in Accra, Ghana. It established a transparency standard that sets requirements for the quality of published data in order to promote harmonization. The data used here come from the database at https://countrydata.iatistandard.org/fr/
[15] At the same time, total international commitments across all sectors amounted to USD 75 billion. The commitment indicator (funding approved by the donor) differs from disbursements and even more from net resource flows, which include, when applicable, loan repayments.
[16] The IATI survey, based on voluntary reporting, is therefore not exhaustive of all interventions in the sector. For example, CSWA’s 2018 report mentions a Spanish debt swap project, the Water Supply Improvement Project (WSIP) in the Volta Region, for USD 3.8 million. Some AFD projects are also not listed.
[17] The rural population proper was estimated at 55% of the total population in 2012.
[18] It should also be noted that this proportion is relatively uniform across the 16 regions, ranging between 56% and 77%, which does not indicate any striking imbalance between them. However, these regional averages conceal disparities between districts, some of which show coverage rates of 40% or even lower (see annex of CSWA’s 2023 annual report).
[19] Until 2018, Ghana was divided into 10 regions; some were subsequently subdivided, and there are now 16 regions.
[20] However, the financing was supplemented by USD 45.7 million in 2017 over a two-year period, while maintaining the original scope.
[21] Districts are the administrative level below the original 10 regions (16 today); there were 216 in 2012 and 261 in 2025.
[22] To which the World Bank and the European Union were the main contributors.
[23] The World Bank project completion report ultimately showed 100% external financing, with the local contribution reduced to zero, while total funding was increased to USD 120 million in 2017.
[24] Only the 2018 and 2023 reports are available online. The 2018 report shows that CSWA’s revenues from donors accounted for half of its total resources that year (30 out of 58 million cedis), though the breakdown of expenditures is not provided. In 2022 and 2023, the proportion fell to 3% and 8% respectively (20 million cedis over the two years), while capital expenditures amounted to 167 million.
[25] It appears that the practice has been discontinued, as it no longer appears in recent reports.
[26] Cited in a study conducted by the Technopolis consulting firm in 2022 on behalf of AFD.
[27] Scaling Fundamentals – Scaling Community of Practice
[28] Advisory support in technological development (selection of more efficient equipment and quality processes such as sanitary treatment and packaging), as well as in management, organizational structuring, and access to financing.
[29] Grandeur et décadence de l’analyse économique des projets | AFD – Agence Française de Développement And PB20_VA_Web.pdf
[30] Taxation, market instruments, foreign direct investment, ODA, blended finance, etc.
[31] Unlocking the potential of public development banks for sustainable development
[32] CASE STUDIES – Scaling Community of Practice
[33] See Beugnot, 2025. Mainstreaming Scaling: A Case study of AFD
[34] Or the institutional partnership function, which often exists among development operators
[35] Modelling Public Banks’ Contribution to the SDGs: A Stock-Flow Consistent (SFC) Approach. The model is designed around seven actors: producers (public and private), consumers, government, and the bank.
[36] If we consider that it is easier or healthier to start from an initial situation in which the banks are not already operating “at the limit” of their regulatory ratios.
[37] That is to say, the contracts it finances are subject to international tenders and are not reserved for French companies, unlike tied aid.